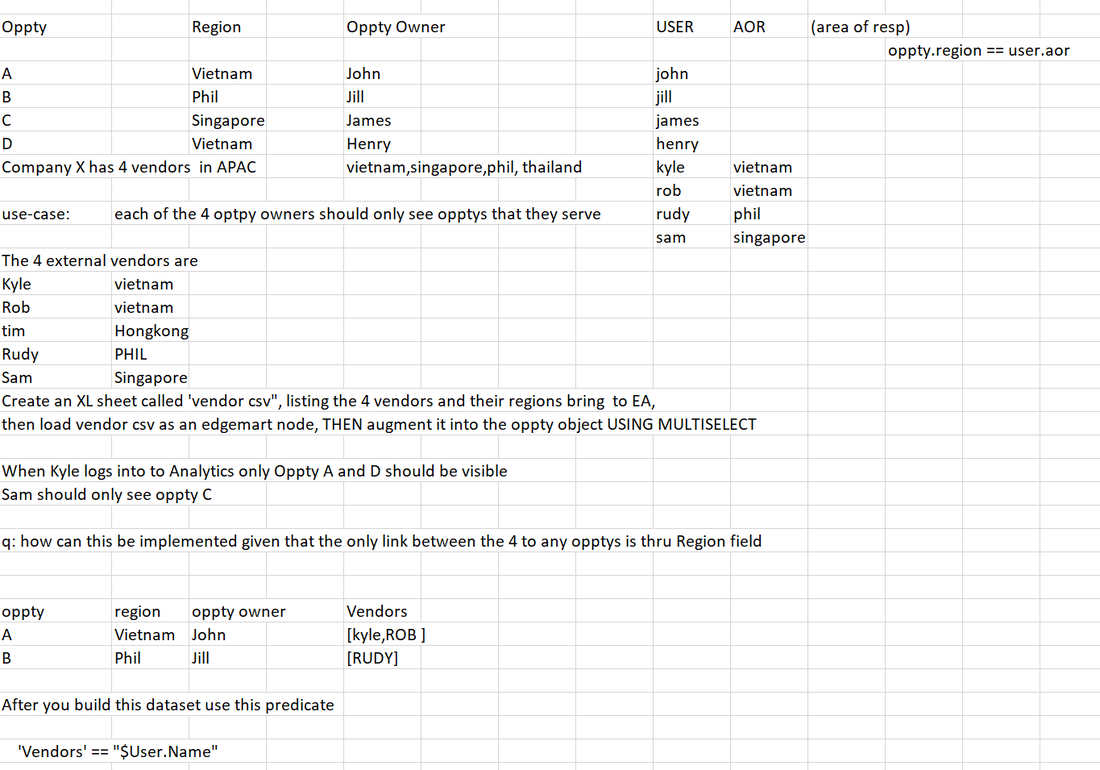
Funnel Chart with detail page faceting.(Bonus!: reordering stagenames w/o showing ordering field)3/5/2023 Below is SAQL code to create a funnel chart based on Stagename and also facet the segment into a table widget.The four different filters creates a separate datastrem to pick out specific rows (q,q2,q3,q4). The 'result=order result by OrdStage orders the rows and then generates the regular stage name.
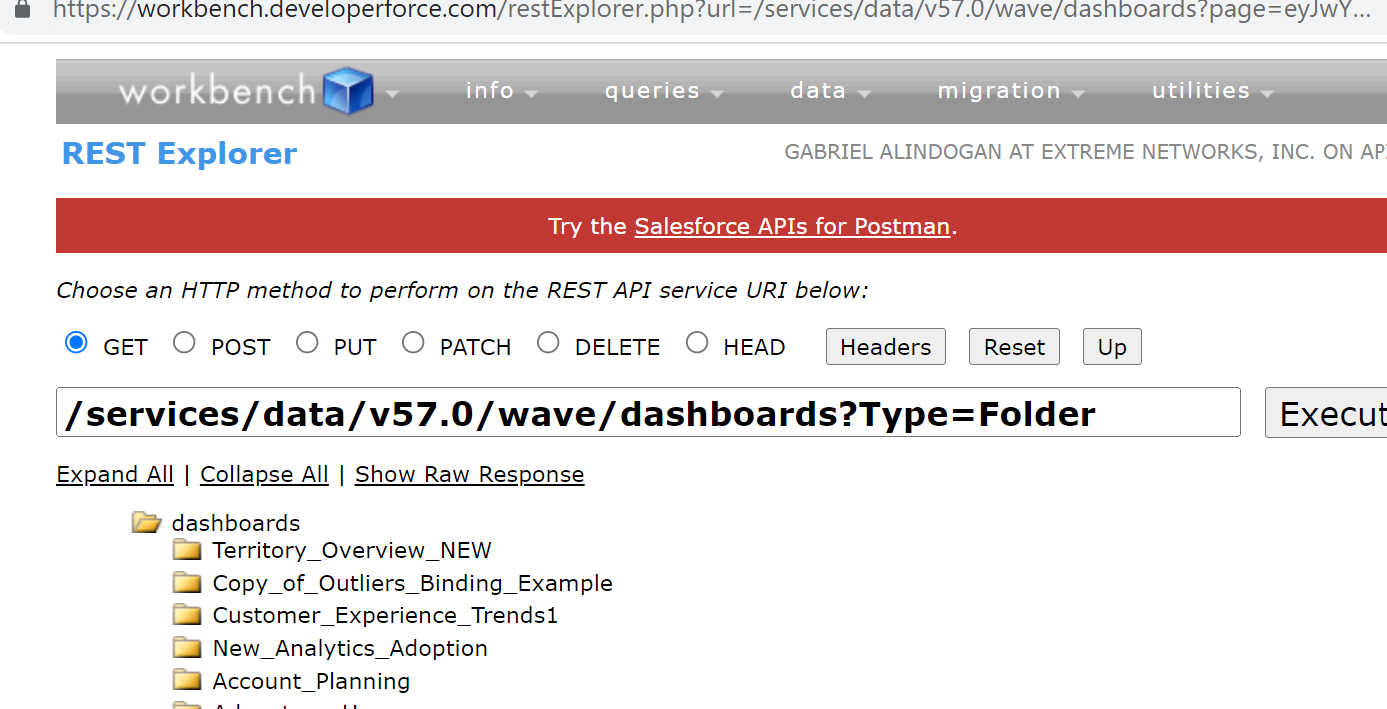
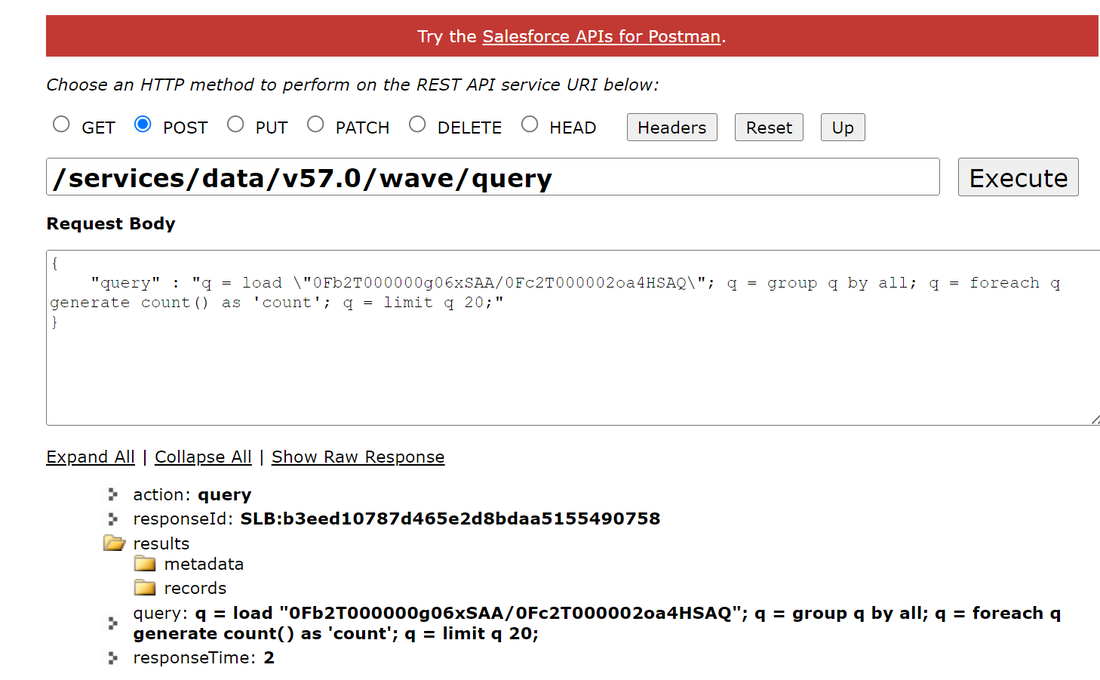
q = load "x_Appl2Participation"; q2=filter q by 'Appl2Participation.Name' is not null; q3 = filter q by 'Appl2Participation.Status__c' == "Referred" ; q4 = filter q by 'Appl2Participation.contact2Appl.Actual_Start_Date__c' is not null; q = group q by 'Contact_Name__c'; q=foreach q generate 'Contact_Name__c',unique('Contact_Name__c') as 'Totals'; q1=group q by all; q1=foreach q1 generate "Attended" as 'Stage',count() as 'Totals'; q2 = group q2 by 'Contact_Name__c'; q2=foreach q2 generate 'Contact_Name__c' as 'Contact_Name__c',unique('Contact_Name__c') as 'Totals'; q2=group q2 by all; q2=foreach q2 generate "Applied" as 'Stage', count() as 'Totals'; q3=group q3 by all; q3=foreach q3 generate "Referred" as 'Stage', count() as 'Totals'; q4=group q4 by 'Contact_Name__c'; q4=foreach q4 generate unique('Contact_Name__c') as 'Totals'; q4=group q4 by all; q4=foreach q4 generate "Hired" as 'Stage',count() as 'Totals'; result=union q1,q2,q3,q4; result=group result by 'Stage'; result=foreach result generate 'Stage' as 'Stage', (case when 'Stage'=="Hired" then "4-Hired" when 'Stage'=="Attended" then "1-Attended" when 'Stage'=="Applied" then "2-Applied" when 'Stage'=="Referred" then "3-Referred" end) as 'OrdStage',sum('Totals') as 'Totals'; result=order result by 'OrdStage'asc; result=foreach result generate 'Stage' as 'Stage',sum('Totals') as 'Totals'; CODE BELOW IS FOR THE TABLE WIDGET WITH FUNNEL_2 beign the name of the above funnel chart. q = load "x_Appl2Participation"; q2=filter q by 'Appl2Participation.Name' is not null; q3 = filter q by 'Appl2Participation.Status__c' == "Referred" ; q4 = filter q by 'Appl2Participation.contact2Appl.Actual_Start_Date__c' is not null; q = group q by 'Contact_Name__c'; q=foreach q generate "Attended" as 'Stage', 'Contact_Name__c'; q2 = group q2 by 'Contact_Name__c'; q2=foreach q2 generate "Applied" as 'Stage','Contact_Name__c' as 'Contact_Name__c'; q3=foreach q3 generate "Referred" as 'Stage','Contact_Name__c' as 'Contact_Name__c'; q4=group q4 by 'Contact_Name__c'; q4=foreach q4 generate "Hired" as 'Stage','Contact_Name__c' as 'Contact_Name__c'; result=union q,q2,q3,q4; result2=filter result by 'Stage' =="{{column(funnel_2.selection, ["Stage"]).asObject()}}"; result2=foreach result2 generate 'Stage' as 'Stage', 'Contact_Name__c' as 'Contact_Name__c'; Most implementations in Einstein Analytics/CRMa start off with data profiling and clean-up. A typical use-care might be to audit an instance, figure out the list of CRMA assets and devide which ones to delete, preserve or modify. There is a tool called workbench which gives a CRMA dev/admin a quicker way to list these assets. Here are sample get/post statments.
Step 1: Start workbench https://workbench.developerforce.com/login.php Step 2: login using current salesforce instance credentials. Step 3: Get to the main workbench page and issue get/post,etc. Here are some examples Code below is for calculating 'prior period' and 'prior year'..somewhat tricky beause it is based on a primary data filter where user picks a varying range of date values--eg. current year, or 4 months to 3 months ago, or 2 months ago to today,etc.. Code for prior year just picks the starting date and ending date and moves it 1 year back.. plain and simple. The prior period calculates time elapsed (ex 4 to 5 months ago is 30 days) . It takes the startign DAte, offsets it by one day, then calculates back for 30 days (using above example)
q = load \"x_LS_Invoice_Volume\";\nq= filter q by {{row(Date_2.selection,[0],[\"min\",\"max\"]).asDateRange(\"date('Date_Year', 'Date_Month', 'Date_Day')\")}};q1 = foreach q generate 'LOB2' as 'lob2','Account.Type' as 'ty','Date' as 'invdt','Date_sec_epoch' as 'sec',toDate('Date_sec_epoch'- 31470526 ) as 'YrAgo', 'Date_sec_epoch'- 86400 as 'yesterday';\nq2=foreach q1 generate'invdt' as 'invDt','sec' as 'sec', 'YrAgo' as 'YrAgo','yesterday' as 'Yesterday';\nq3=group q2 by all;\nq3=foreach q3 generate min('sec') as 'StartingDtSec',max('sec') as 'EndingDtSec',toDate(min('sec')) as 'StartingDt',toDate(max('sec')) as 'EndingDt', min('YrAgo') as'StartingPrevYrDt',max('YrAgo') as 'EndingPrevYrDt',min('Yesterday') as 'PeriodEnd_seconds',toDate(min('Yesterday')) as 'PeriodEndDate';\nq4 = foreach q3 generate 'StartingDt' as 'StartingDt','StartingDtSec'as 'StartingDtSec','EndingDtSec' as 'EndingDtSec', 'EndingDt' as 'EndingDt', 'StartingPrevYrDt' as 'StartingPrevYrDt', 'EndingPrevYrDt' as 'EndingPrevYrDt','PeriodEnd_seconds' as 'PeriodEnd_seconds', 'PeriodEndDate' as 'PeriodEndDate',date_diff(\"day\",toDate('StartingDtSec'),toDate('EndingDtSec')) as 'delta';\nq5 = foreach q4 generate 'StartingDt' as 'StartingDt', 'EndingDt' as 'EndingDt','StartingDtSec'as 'StartingDtSec','EndingDtSec' as 'EndingDtSec', 'StartingPrevYrDt' as 'StartingPrevYrDt', 'EndingPrevYrDt' as 'EndingPrevYrDt', date_to_epoch('StartingPrevYrDt')as 'StartingPrevYrDt_seconds',date_to_epoch('EndingPrevYrDt')+ 86400 as 'EndingPrevYrDt_seconds', 'PeriodEnd_seconds' as 'PeriodEnd_seconds', 'PeriodEndDate' as 'PeriodEndDate','delta' as 'delta',toDate(date_to_epoch('StartingDt') - 86400 * 'delta' )as 'PeriodStartDt',date_to_epoch('StartingDt') - 86400 * 'delta' as 'PeriodStartDt_seconds'; q1 = filter q by {{column(timeStampText_4.selection,["Snapshot1"]).asEquality('timeStampText')}};
q1 = filter q1 by date('CloseDate_Year', 'CloseDate_Month', 'CloseDate_Day') in {{cell(static_2.selection,0,"Valu").asString()}}; q2 = filter q by {{column(timeStampText_5.selection,["Snapshot2"]).asEquality('timeStampText')}}; q2 = filter q2 by date('CloseDate_Year', 'CloseDate_Month', 'CloseDate_Day') in {{cell(q_FY2_1.selection,0,"Valu").asString()}}; result = group q1 by '{{column(static_1.selection, ["Valu"]).asObject()}}' full, q2 by '{{column(static_1.selection, ["Valu"]).asObject()}}'; result = foreach result generate coalesce(q1.'{{column(static_1.selection, ["Valu"]).asObject()}}', q2.'{{column(static_1.selection, ["Valu"]).asObject()}}' ) as '{{column(static_1.selection, ["Valu"]).asObject()}}', round(sum(q1.'Amt'),0) as 'Pipeline1 Amt',round(sum(q2.'Amt'), 0) as 'Pipeline2 Amt', round((sum(q1.'Amt')- sum(q2.'Amt')), 0) as 'Difference'; result = order result by ('{{column(static_1.selection, ["Valu"]).asObject()}}'asc); q3 = filter q by {{column(timeStampText_4.selection,["Snapshot1"]).asEquality('timeStampText')}}; q3 = filter q3 by date('CloseDate_Year', 'CloseDate_Month', 'CloseDate_Day') in {{cell(static_2.selection,0,"Valu").asString()}}; q4 = filter q by {{column(timeStampText_5.selection,["Snapshot2"]).asEquality('timeStampText')}}; q4 = filter q4 by date('CloseDate_Year', 'CloseDate_Month', 'CloseDate_Day') in {{cell(q_FY2_1.selection,0,"Valu").asString()}}; Great article on CRMA vs. Native Salesforce reporting.
https://marktossell.com/2022/10/22/why-do-you-need-crma/
So client wants 2 snapshot dates populated . Snap1 is the most recent snapshot--easy enough to accomplish by a query sorted in ascending order which takes the most recent one and puts it in snap1list selector. The 2nd snapdate is 1 year back. This can be done by populating the 'start' attribute in dashboard JSON with a results from query 'q_oneYrBack_1'.
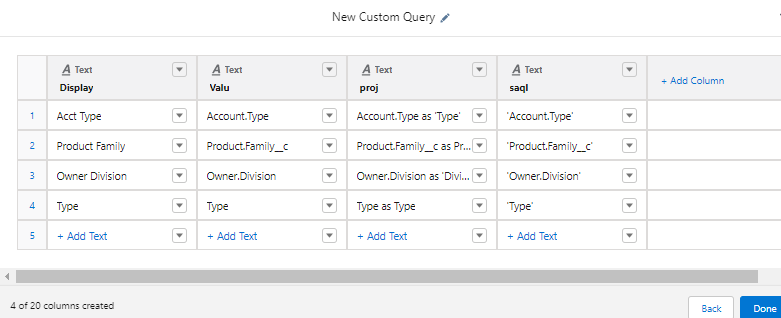
"start": "{{cell(q_oneYrBack_1.result,0,\"sd2\").asString()}}" "q_oneYrBack_1": { "broadcastFacet": true, "groups": [], "label": "q_oneYrBack", "numbers": [], "query": "q = load \"zds_completeOpptys_v2\";\nq = filter q by date('SnapshotStamp_Year', 'SnapshotStamp_Month', 'SnapshotStamp_Day') in [\"365 days ago\"..\"365 days ago\"];\nq= group q by 'SnapshotStamp';\nq = foreach q generate 'SnapshotStamp' as 'sd', substr('SnapshotStamp',2,10) as 'sd2';", "receiveFacetSource": { Sd2 resolved to text in yyyy-MM-dd format (hence the 10 character string in the substr function). AS a followup to the March 3, 2021 blog regarding creating a flex-grid where the pivots are dynamic.. sorta like OLAP. Below is code for using saql as opposed to aggregate. Here is a snip of the custom query. Pay attention to the saql column and notice the ' ' on the API names. After it is the snip of the saql query.
q = load \"x_MasterSalesData\";\nq = group q by ({{column(static_2.selection,[\"saql\"]).asObject()}});\nq = foreach q generate {{column(static_2.selection,[\"saql\"]).asObject()}}, count() as 'count';\n" so let's say you have 'due Date' and you want to see it in week-year format.. ex "2-2022" or 54 - 2022. One of the ways it can be achieved ,in addition to dashboaard xmd? is to use multi datastream. In example below, the q2 datastream highlights the ww-yyyy format.
q = load "TaskWithDetails"; q = group q by ('ActivityDate_Year', 'ActivityDate_Week'); q = foreach q generate 'ActivityDate_Year' + "~~~" + 'ActivityDate_Week' as 'ActivityDate_Year~~~ActivityDate_Week', 'ActivityDate_Week' + "~~~" + 'ActivityDate_Year' as 'ActivityDate_Week~~~ActivityDate_Year',count() as 'count'; q = order q by 'ActivityDate_Year~~~ActivityDate_Week' asc; q2 = foreach q generate 'ActivityDate_Week~~~ActivityDate_Year' as 'ActivityDate_Week~~~ActivityDate_Year', count() as 'count'; There are several key differences between dataflows and recipes and I will be going over a few of them.
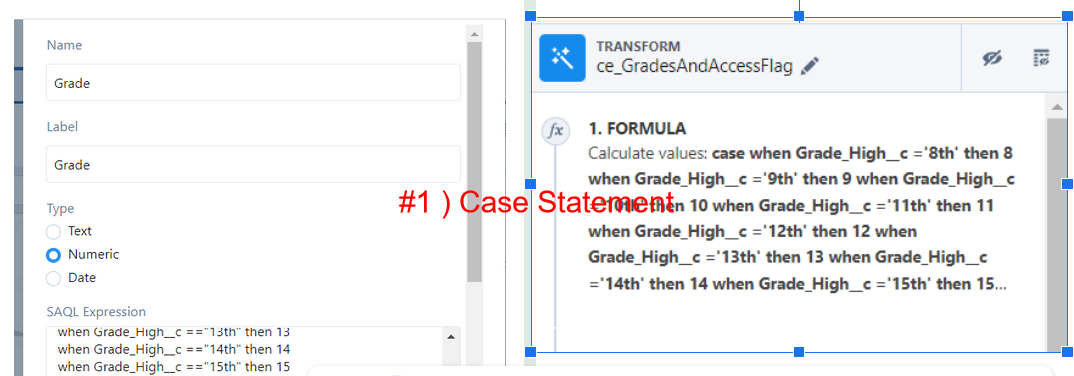
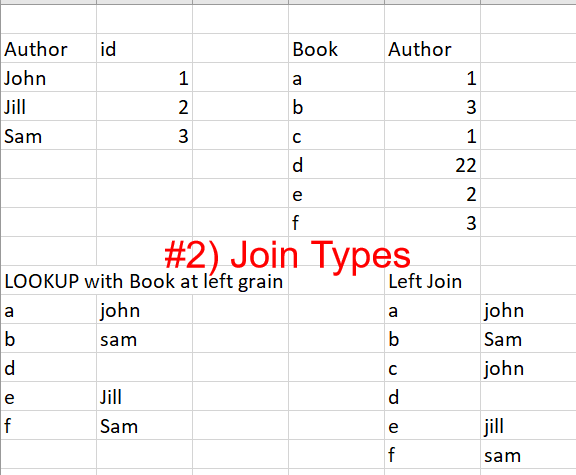
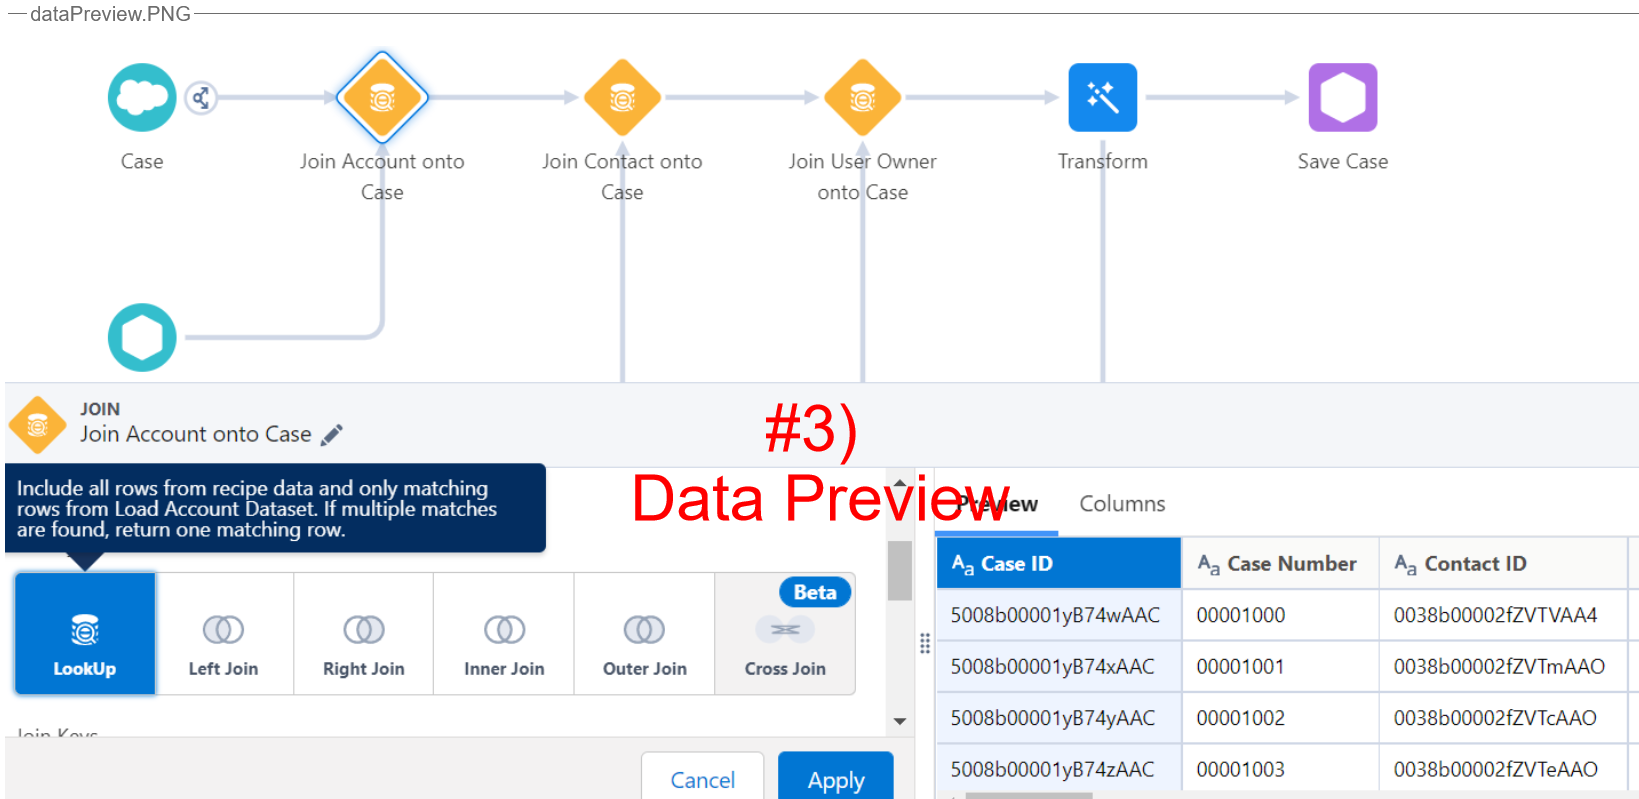
#1) slight variation in case statements: Dataflows: case when Grade_High__c == “13th ” then 13 when Grade_High__c == “14th ” then 14 else 0 end Recipes: case when Grade_High__c = ‘13th’ then 13 when Grade_High__c = ‘14th’ then 14 else 0 end #2) Creating outer/inner joins more straightforward in recipes using selection buttons. Be careful to distinguish between ‘lookups’ and left joins. (hint: lookups return the first instance of matching rows while left outer returns all.. #3) Data preview INSIDE the recipe reduces the need to create intermediate datasets to verify contents of dataset as it goes thru the different transformations. case when 'Dept_Chair_Acct__c' =="true" then "https://xxxxxxx/file-asset/checkboxtickpng1" else "https://xxxxxxxx/file-asset/checkboxuntickpng1"
end Q_runrates_1
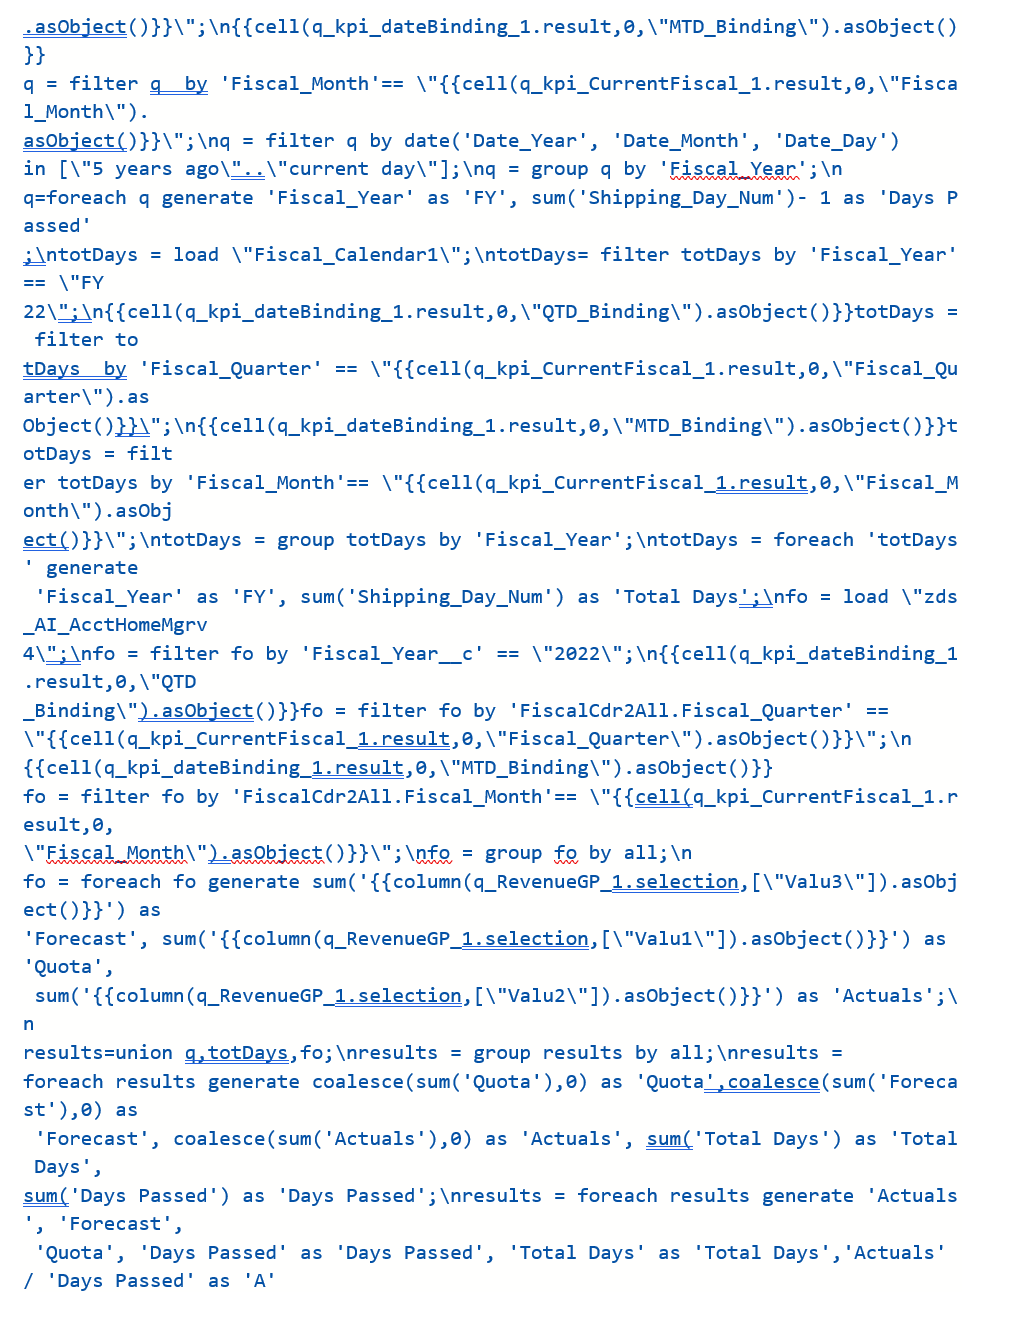
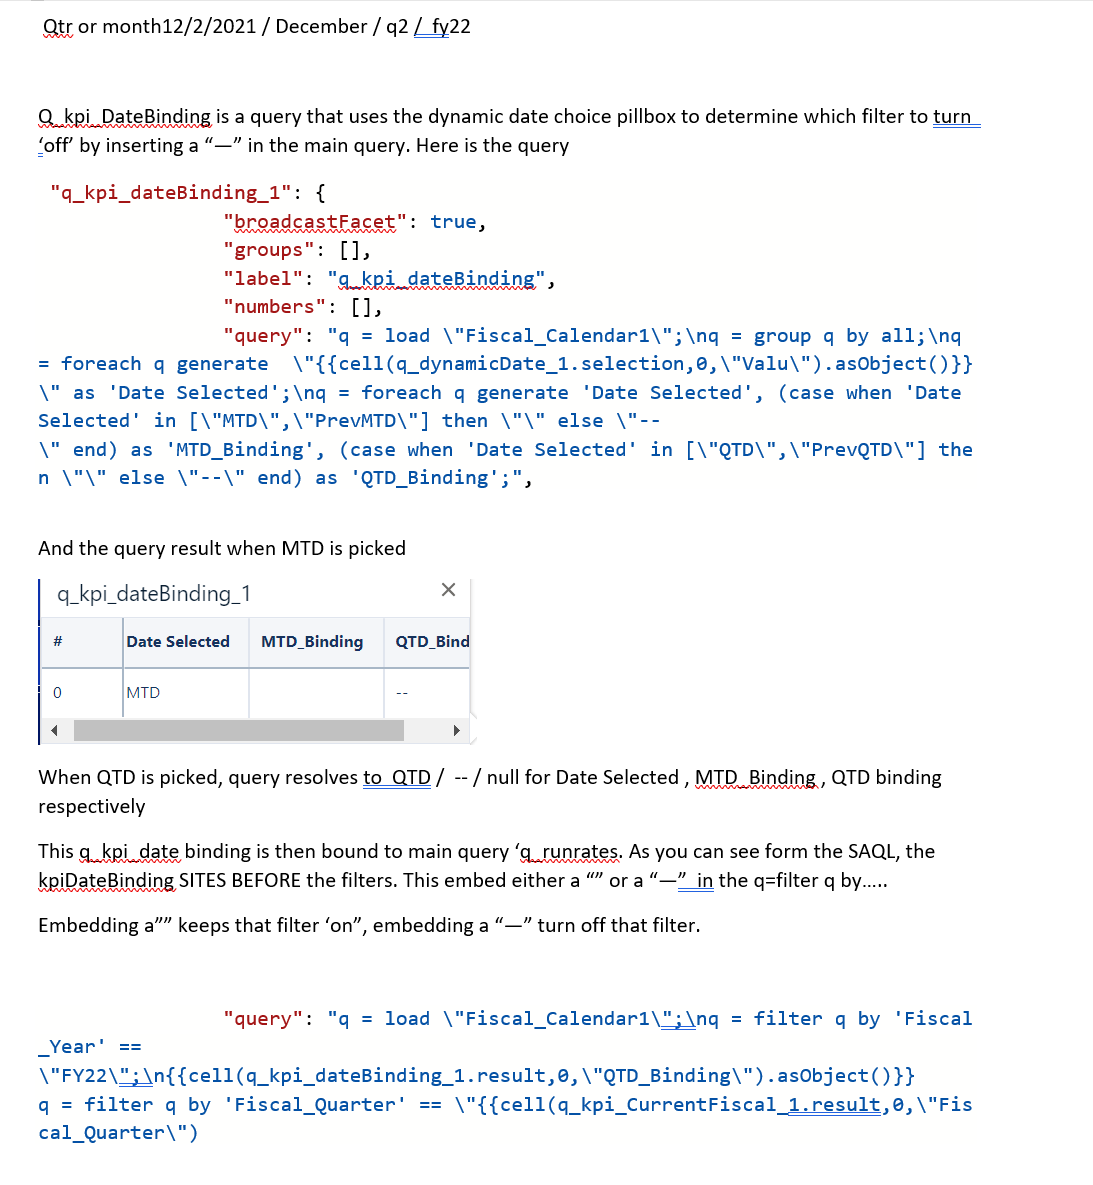
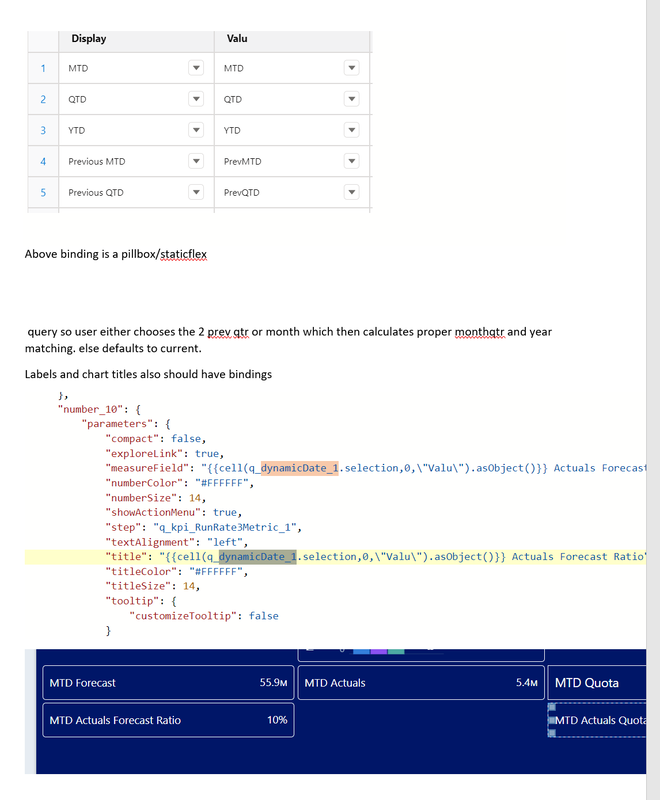
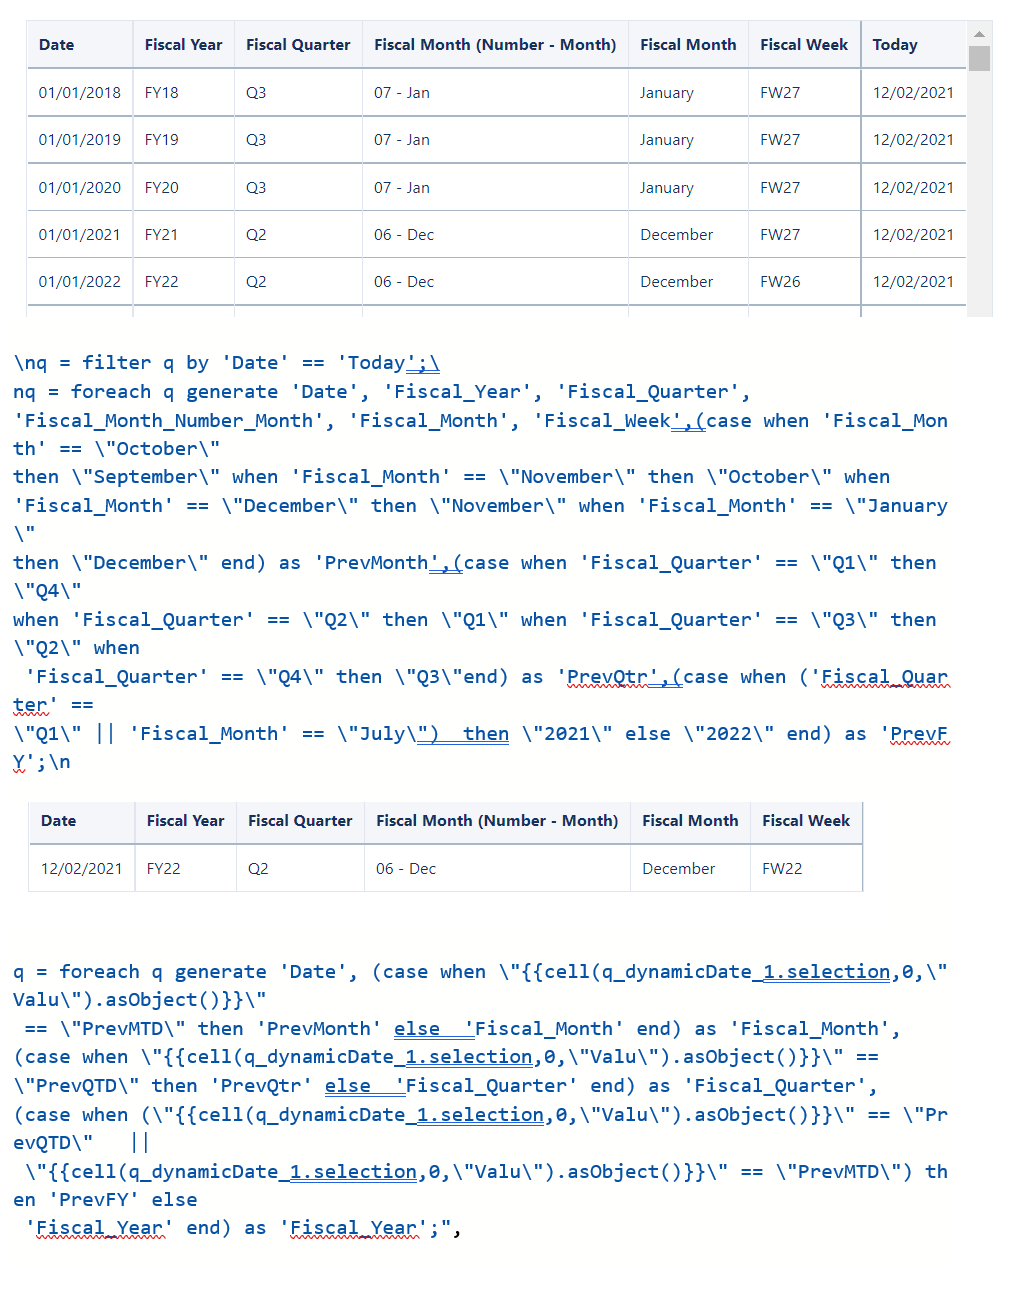
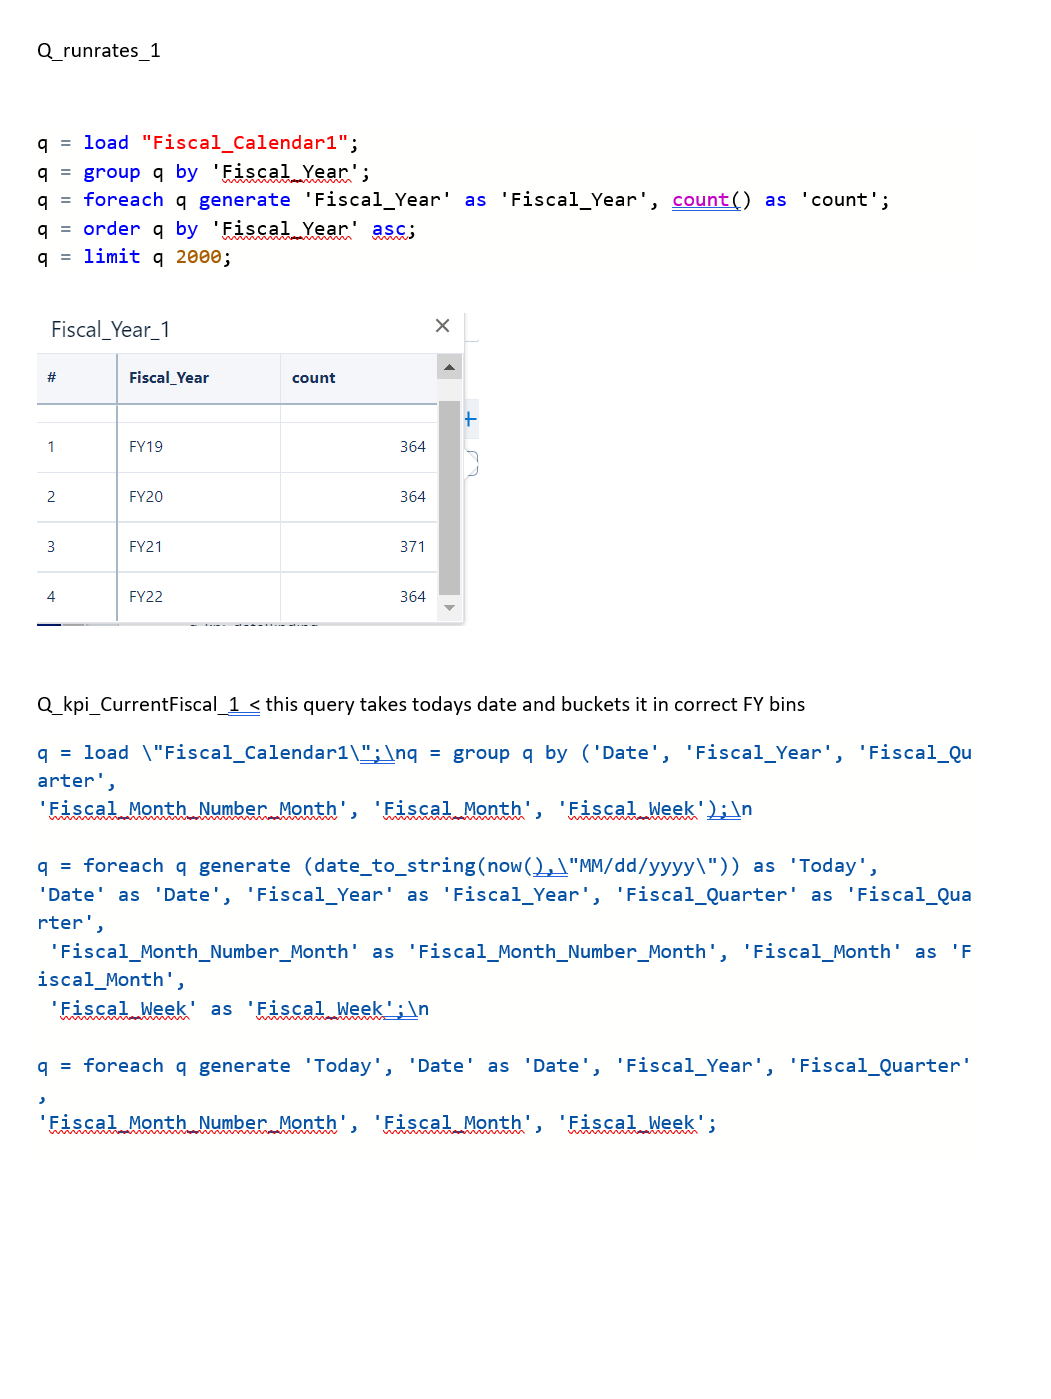
q = load "Fiscal_Calendar1"; q = group q by 'Fiscal_Year'; q = foreach q generate 'Fiscal_Year' as 'Fiscal_Year', count() as 'count'; q = order q by 'Fiscal_Year' asc; q = limit q 2000; Q_kpi_CurrentFiscal_1 < this query takes todays date and buckets it in correct FY bins q = load \"Fiscal_Calendar1\";\nq = group q by ('Date', 'Fiscal_Year', 'Fiscal_Quarter', 'Fiscal_Month_Number_Month', 'Fiscal_Month', 'Fiscal_Week');\n q = foreach q generate (date_to_string(now(),\"MM/dd/yyyy\")) as 'Today', 'Date' as 'Date', 'Fiscal_Year' as 'Fiscal_Year', 'Fiscal_Quarter' as 'Fiscal_Quarter', 'Fiscal_Month_Number_Month' as 'Fiscal_Month_Number_Month', 'Fiscal_Month' as 'Fiscal_Month', 'Fiscal_Week' as 'Fiscal_Week';\n q = foreach q generate 'Today', 'Date' as 'Date', 'Fiscal_Year', 'Fiscal_Quarter', 'Fiscal_Month_Number_Month', 'Fiscal_Month', 'Fiscal_Week'; \nq = filter q by 'Date' == 'Today';\ nq = foreach q generate 'Date', 'Fiscal_Year', 'Fiscal_Quarter', 'Fiscal_Month_Number_Month', 'Fiscal_Month', 'Fiscal_Week',(case when 'Fiscal_Month' == \"October\" then \"September\" when 'Fiscal_Month' == \"November\" then \"October\" when 'Fiscal_Month' == \"December\" then \"November\" when 'Fiscal_Month' == \"January\" then \"December\" end) as 'PrevMonth',(case when 'Fiscal_Quarter' == \"Q1\" then \"Q4\" when 'Fiscal_Quarter' == \"Q2\" then \"Q1\" when 'Fiscal_Quarter' == \"Q3\" then \"Q2\" when 'Fiscal_Quarter' == \"Q4\" then \"Q3\"end) as 'PrevQtr',(case when ('Fiscal_Quarter' == \"Q1\" || 'Fiscal_Month' == \"July\") then \"2021\" else \"2022\" end) as 'PrevFY';\n q = foreach q generate 'Date', (case when \"{{cell(q_dynamicDate_1.selection,0,\"Valu\").asObject()}}\" == \"PrevMTD\" then 'PrevMonth' else 'Fiscal_Month' end) as 'Fiscal_Month', (case when \"{{cell(q_dynamicDate_1.selection,0,\"Valu\").asObject()}}\" == \"PrevQTD\" then 'PrevQtr' else 'Fiscal_Quarter' end) as 'Fiscal_Quarter', (case when (\"{{cell(q_dynamicDate_1.selection,0,\"Valu\").asObject()}}\" == \"PrevQTD\" || \"{{cell(q_dynamicDate_1.selection,0,\"Valu\").asObject()}}\" == \"PrevMTD\") then 'PrevFY' else 'Fiscal_Year' end) as 'Fiscal_Year';", Above binding is a pillbox/staticflex query so user either chooses the 2 prev qtr or month which then calculates proper monthqtr and year matching. else defaults to current. Labels and chart titles also should have bindings Qtr or month12/2/2021 / December / q2 / fy22 Q_kpi_DateBinding is a query that uses the dynamic date choice pillbox to determine which filter to turn ‘off’ by inserting a “—” in the main query. Here is the query "q_kpi_dateBinding_1": { "broadcastFacet": true, "groups": [], "label": "q_kpi_dateBinding", "numbers": [], "query": "q = load \"Fiscal_Calendar1\";\nq = group q by all;\nq = foreach q generate \"{{cell(q_dynamicDate_1.selection,0,\"Valu\").asObject()}}\" as 'Date Selected';\nq = foreach q generate 'Date Selected', (case when 'Date Selected' in [\"MTD\",\"PrevMTD\"] then \"\" else \"--\" end) as 'MTD_Binding', (case when 'Date Selected' in [\"QTD\",\"PrevQTD\"] then \"\" else \"--\" end) as 'QTD_Binding';", And the query result when MTD is picked When QTD is picked, query resolves to QTD / -- / null for Date Selected , MTD_Binding , QTD binding respectively This q_kpi_date binding is then bound to main query ‘q_runrates. As you can see form the SAQL, the kpiDateBinding SITES BEFORE the filters. This embed either a “” or a “—” in the q=filter q by….. Embedding a”” keeps that filter ‘on”, embedding a “—” turn off that filter. "query": "q = load \"Fiscal_Calendar1\";\nq = filter q by 'Fiscal_Year' == \"FY22\";\n{{cell(q_kpi_dateBinding_1.result,0,\"QTD_Binding\").asObject()}} q = filter q by 'Fiscal_Quarter' == \"{{cell(q_kpi_CurrentFiscal_1.result,0,\"Fiscal_Quarter\") .asObject()}}\";\n{{cell(q_kpi_dateBinding_1.result,0,\"MTD_Binding\").asObject()}} q = filter q by 'Fiscal_Month'== \"{{cell(q_kpi_CurrentFiscal_1.result,0,\"Fiscal_Month\"). asObject()}}\";\nq = filter q by date('Date_Year', 'Date_Month', 'Date_Day') in [\"5 years ago\"..\"current day\"];\nq = group q by 'Fiscal_Year';\n q=foreach q generate 'Fiscal_Year' as 'FY', sum('Shipping_Day_Num')- 1 as 'Days Passed' ;\ntotDays = load \"Fiscal_Calendar1\";\ntotDays= filter totDays by 'Fiscal_Year'== \"FY 22\";\n{{cell(q_kpi_dateBinding_1.result,0,\"QTD_Binding\").asObject()}}totDays = filter to tDays by 'Fiscal_Quarter' == \"{{cell(q_kpi_CurrentFiscal_1.result,0,\"Fiscal_Quarter\").as Object()}}\";\n{{cell(q_kpi_dateBinding_1.result,0,\"MTD_Binding\").asObject()}}totDays = filt er totDays by 'Fiscal_Month'== \"{{cell(q_kpi_CurrentFiscal_1.result,0,\"Fiscal_Month\").asObj ect()}}\";\ntotDays = group totDays by 'Fiscal_Year';\ntotDays = foreach 'totDays' generate 'Fiscal_Year' as 'FY', sum('Shipping_Day_Num') as 'Total Days';\nfo = load \"zds_AI_AcctHomeMgrv 4\";\nfo = filter fo by 'Fiscal_Year__c' == \"2022\";\n{{cell(q_kpi_dateBinding_1.result,0,\"QTD _Binding\").asObject()}}fo = filter fo by 'FiscalCdr2All.Fiscal_Quarter' == \"{{cell(q_kpi_CurrentFiscal_1.result,0,\"Fiscal_Quarter\").asObject()}}\";\n {{cell(q_kpi_dateBinding_1.result,0,\"MTD_Binding\").asObject()}} fo = filter fo by 'FiscalCdr2All.Fiscal_Month'== \"{{cell(q_kpi_CurrentFiscal_1.result,0, \"Fiscal_Month\").asObject()}}\";\nfo = group fo by all;\n fo = foreach fo generate sum('{{column(q_RevenueGP_1.selection,[\"Valu3\"]).asObject()}}') as 'Forecast', sum('{{column(q_RevenueGP_1.selection,[\"Valu1\"]).asObject()}}') as 'Quota', sum('{{column(q_RevenueGP_1.selection,[\"Valu2\"]).asObject()}}') as 'Actuals';\n results=union q,totDays,fo;\nresults = group results by all;\nresults = foreach results generate coalesce(sum('Quota'),0) as 'Quota',coalesce(sum('Forecast'),0) as 'Forecast', coalesce(sum('Actuals'),0) as 'Actuals', sum('Total Days') as 'Total Days', sum('Days Passed') as 'Days Passed';\nresults = foreach results generate 'Actuals', 'Forecast', 'Quota', 'Days Passed' as 'Days Passed', 'Total Days' as 'Total Days','Actuals' / 'Days Passed' as 'A' ,'Quota' / 'Total Days' as 'B';\nresults = foreach results generate 'Actuals', 'Forecast', 'Quota', 'Days Passed' as 'Days Passed', 'Total Days' as 'Total Days','A' as 'A','B' as'B','A' / 'B' as 'Run Rate','Quota' - 'Actuals' as 'To Quota';\nresults = foreach results generate 'Actuals', 'Forecast', 'Quota', 'Days Passed' as 'Days Passed', 'Total Days' as 'Total Days','Run Rate',('Quota' * 'Run Rate') as 'RR Dollars';" Use of SAQL Index-Of() to pick out certain roles in a Flatten Transformation - by Dan Alindogan3/8/2022 Here’s an interesting use-case for a client of ours. They need reports that will be available to users who have a certain role ‘X” as well as having the same security for the role 2 levels up. This means that it has to bypass the next level up. Illustratively, given a role path of x / y / z / k / m, the data needs to be seen by roles x and z. In order to effect that, a flatten transformation with the self-Id checked is used, followed by a compute expression and the’ index_of’ string function. Listed below are the steps and settings as well as a link to the SAQL function “index_of” . To start off, the function “index_of” resolves to an integer marking the location of a specific character inside a string. https://developer.salesforce.com/docs/atlas.en-us.bi_dev_guide_saql.meta/bi_dev_guide_saql/bi_saql_functions_string_io.htm index_of(“connecticut” , “c”, 1,1) = 1 index_of (“connecticut”, “c”, 1, 3) = 9 index_of(“connecticut”, “c” 1,4) = 0 Why should someone integrate the function “index_of” into their SAQL? One reason is to isolate certain strings and use them when there is a flatten node dealing with Role Path. Here is an example of how we can use the “index_of” in a case where the role is in the security predicate. We want to show how we can filter out the appropriate role out of the string created by the flatten transformation. Role Path:
substring(‘Product’, , case index_of (“/”, 1, 2) = 10 then 10 , case index_of(“/”, 1,1) = 5 then 0 Else 0 ) then +1, 4) Resolves to:
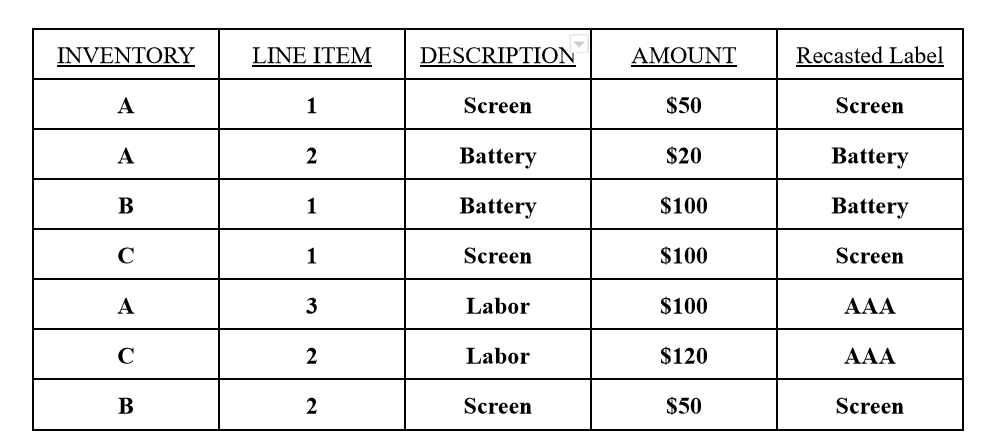
Note: the 2nd case statement (, case index_of(“/”, 1,1) = 5 then 0 ) is superfluous but is there to show that anything other than the 2nd occurrence is “/” is ignored since we are interested in the self id and the 3rd role. After assigning the result of the ‘Resolves to’ list to a variable called ’ProperRole’, one can then insert it in the security predicate (ie… ‘ProperRole’ == $user.RoleID ) An interesting use-case came up with one of our supply chain clients. They needed to bin certain invoices into 1 of two categories--1) Full Service (any invoice that contains a 'Service Contract' line item OR 2) Retail (any invoice that does not have a service contract). This use-case utilizes 2 powerful TCRM nodes-- the compute relative and the compute expression.
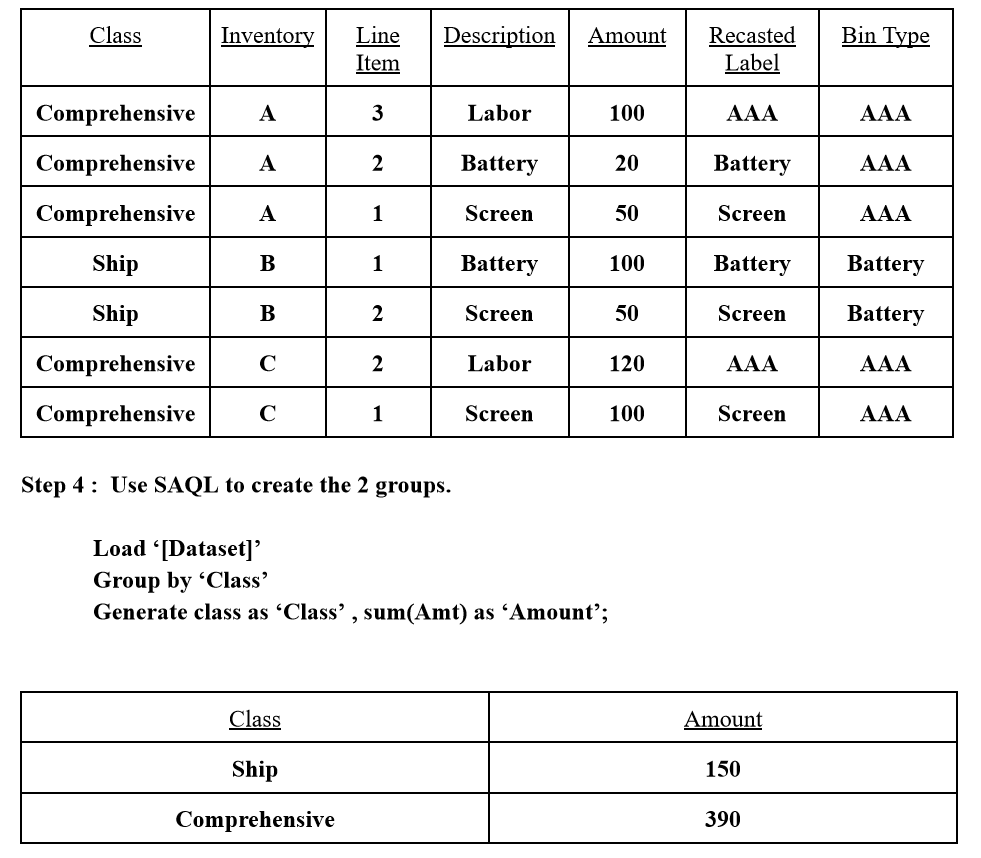
At a high level, the compute relative enables a comparison up and down the table (ie rows) while the compute expression goes left > right ie columns. Down below I will show a step by step guide to how one would tackle this use case. Step 1: Create a compute expression and label it as ‘Recasted Label’ (SAQL pseudocode follows) Load ‘[Dataset]’ Case when ‘Description’’ == “Labor” then “AAA” else “[Description]” Step 2: Use a Compute Relative Node to create a field called ‘Bin Type’ using the following settings in the Dialogue Box of that node Group by InventorySort by ‘Recasted Label’ Asc Create new field —> ‘Bin Type’ Aggregate f(x) = ‘first’ Step 3: Use a Compute Expression to create a new field “Class” using a CASE Statement. Case when ‘Bin Type’ != “AAA” Then “Ship” else “Comprehensive” so let's say you have a set of metrics that you want to create a time-series on. Maybe your team makes sales forecast on clients that changes over time. You can take a 'snapshot' of that forcast daily thru a scheduled dataflow and an append transformation node. At the end of a certain period your dataset may look like this...
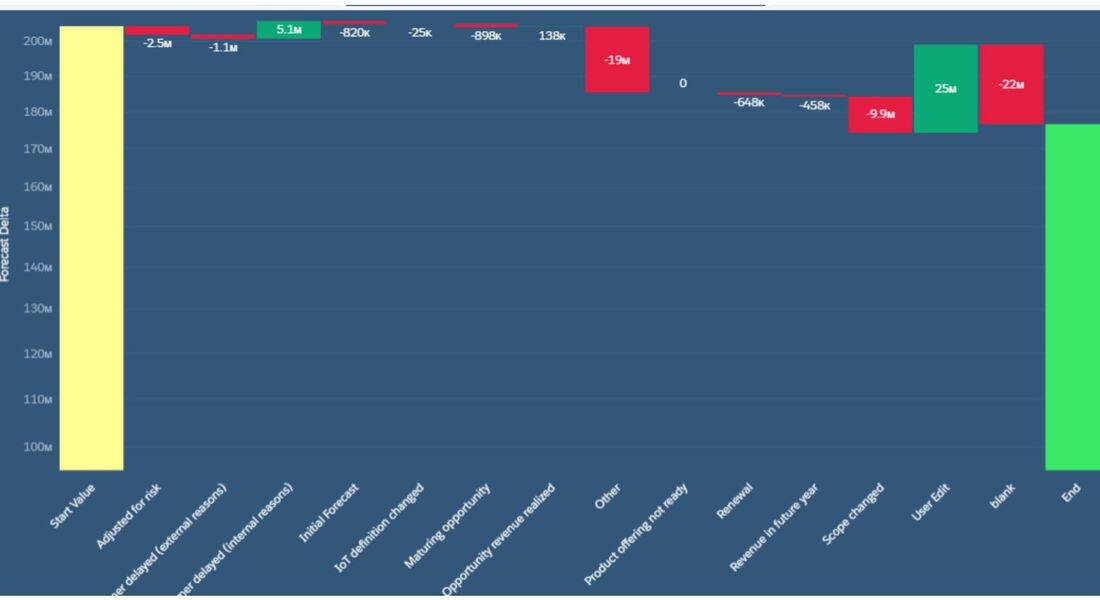
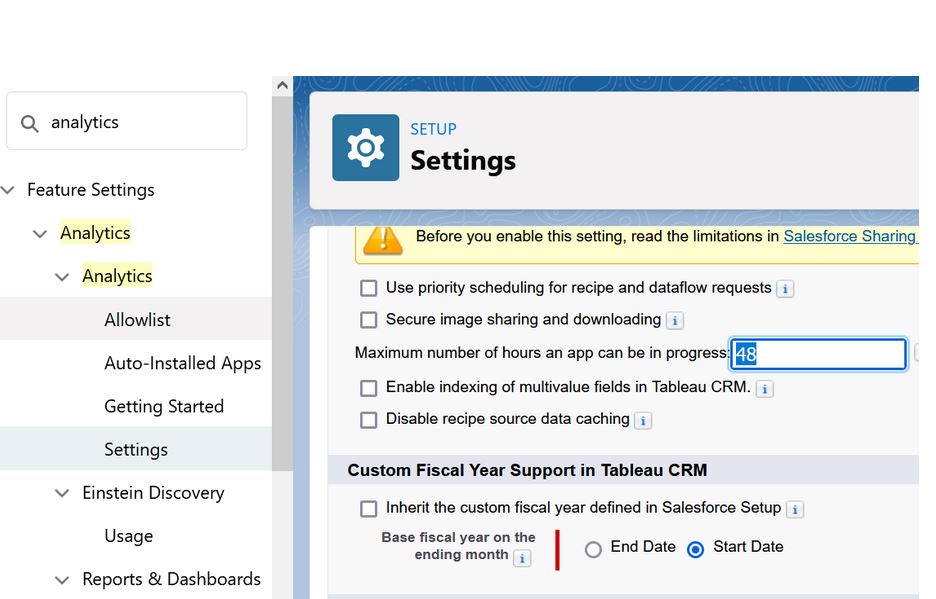
Client Date Forecast A January 3 $1000 B January 3 $5000 A March 2 $2000 B March 2 $3000 Code below creates a waterfall chart with a binding to control the grouping trigger. q = load \"zds_IoTForecast5\";\nstartVal = filter q by {{column(qDateTest_1.selection,[\"cTimeStampText\"]).asEquality('cTimeStampText')}};\nendVal = filter q by {{column(q_SnapDate2_1.selection,[\"cTimeStampText\"]).asEquality('cTimeStampText')}};\nq_A = filter q by {{column(qDateTest_1.selection,[\"cTimeStampText\"]).asEquality('cTimeStampText')}};\nq_B = filter q by {{column(q_SnapDate2_1.selection,[\"cTimeStampText\"]).asEquality('cTimeStampText')}};\nstartVal = group startVal by all;\nstartVal = foreach startVal generate \"Start Value\" as '{{column(static_6.selection,[\"Valu\"]).asObject()}}',number_to_string(sum (startVal.'TotValueUSD'),\"$#,###\") as 'Forecast Delta';\nendVal = group endVal by all;\nresult = group q_A by '{{column(static_6.selection,[\"Valu\"]).asObject()}}' full, q_B by '{{column(static_6.selection,[\"Valu\"]).asObject()}}';\nresult = foreach result generate coalesce(q_A.'{{column(static_6.selection,[\"Valu\"]).asObject()}}', q_B.'{{column(static_6.selection,[\"Valu\"]).asObject()}}') as '{{column(static_6.selection,[\"Valu\"]).asObject()}}',coalesce(sum(q_A.'TotValueUSD'),0) as 'A', coalesce(sum(q_B.'TotValueUSD'),0) as 'B';\nresult = foreach result generate '{{column(static_6.selection,[\"Valu\"]).asObject()}}',number_to_string( B-A,\"$#,###\") as 'Forecast Delta';\nendVal = foreach endVal generate \"Ending Value\" as '{{column(static_6.selection,[\"Valu\"]).asObject()}}',number_to_string(sum (endVal.'TotValueUSD'),\"$#,###\") as 'Forecast Delta';\nresult = order result by '{{column(static_6.selection,[\"Valu\"]).asObject()}}' asc;\nfinal = union startVal,result,endVal; This setting is enabled in the Salesforce CRM side by your system administrator. Setting this enables accurate fiscal year groupings / filters in TCRM.
After creating the dataset that contains a flatten transformation, you need to modify the dataset XMD and turn 'isSystemField' to 'false' . This will enable user to see the field in a lens to debug.
CODE BELOW { "flattnMgr": { "schema": { "objects": [ { "label": "ManagerPathText", "fields": [ { "name": "mgrPath", "label": "mgrPath", "isSystemField": false }, { "name": "ManagersList", "label": "ManagersList", "isSystemField": false } ] } ] }, "action": "flatten", "parameters": { "include_self_id": false, "self_field": "Id", "multi_field": "ManagersList", "parent_field": "ManagerId", "path_field": "mgrPath", "source": "LoadUser" } } |

