Meliorainsights.com
|
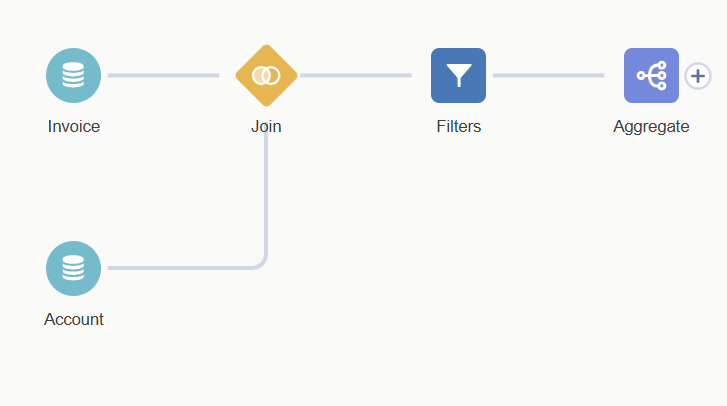
Calculated insight is a powerful feature in Data Cloud--similar to recipes and dataflows in CRM Analytics(aka Einstein analytics) which enable users to make transformations and calculations on data. It starts with a blank 'canvas' where a dev can drag different nodes into the canvas to design the data manipulations desired. There are nodes to ingest data, to filter, to aggregate,to flatten hierachies,etc. Below are 2 snips-- Snip #1 is a sample Calculated Insight with nodes to aggregate invoice amounts per account and Snip # 2 -- a mock up of the behind-the-scene data transformation that happens after each node gets processed.
0 Comments
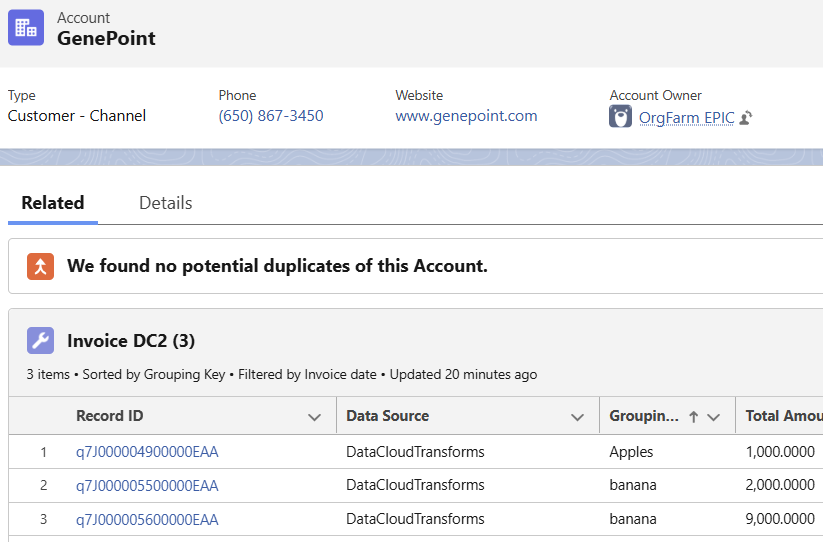
One of the value-added elements of data cloud is to render a related list into a SF CRM object-accounts, contacts. It may be transactional data, product list,etc that is tied to that single row in the CRM object. E.g. A user opens up an Accounts page, and sees a related list of invoices (snip below) for that account COMING FROM an external dataset (csv, Azure,SAP).
A few gotchas...1) Click on 'Settings' >'Obj manager' > 'Data Cloud related list' >New> pick the related list object. eg: Invoices, or Sales Orders 2) if those objects is not showing up in the drop down, make sure the 'relationships' are defined properly in the 2 DMO's-- the main one and the child one. 3) Make sure the fields relating them are account ID or contact Id NOT SOME EXTERNAL ID. 4)include that DMO in the page layout under 'related list' 5)make sure to create dynamic 'Related List-single' under lightning app builder 6) lastly, make sure to add a filter in the page 9eg. posting date not null) when using the 'Lightning App Builder' A collegue of mine posted this ..
A "bug" about Data Cloud identity resolution/ data reconciliation... 1- Email is the SubscriberKey in SFMC and is mapped to Individual Id in DMO. 2- Identity Resolution is set based on the rule Email Address Exact Normalized matching. Which should ignore the case of the Email to match. 3- Subscriber preferences mapped to Contact Point Email where SubscriberKey is mapped to Party field. SubscriberKey(EmailAddress) has a different case(Capital first letter or all Caps) than step 1 Profile Data Stream. 4- When the Identity Resolution is run, it matches the Profiles... and also moves/reconciles the data from Contact Point Email to Contact Point Email Identity Link DMO... works fine... no issues due to case difference. But it also moves the data from Contact Point Email Identity Link DMO to Unified Contact Point Email DMO (which actually has relationship to Unified Individual DMO and is used in the Segmentation etc) doesn't get the data if the case is different. The workaround is make sure that the SubscriberKey in Step 3 has the exact same case as in the Profile Data Stream in Step 1. Great article on the differences between Tableau and CRMA (aka Einstein analytics)
https://atrium.ai/resources/should-i-choose-tableau-or-crm-analytics-for-my-salesforce-use-case/ Issues Encountered in deployment from lower to higher sandboxes
Issue: Dashboard errored out since recipe needed to be run ( invalid Dataset ID ) Solution: Run the recipe Issue: Recipe can't run because fields were missing Solution: Verify fields exists in SFDC using object manager, then going into the proper perm set >object settings to see if 'read' permission is checked, then assigning the perm set to user, integration user and security user. After this step, verify the fields are ready to be synched by 'analytics studio' > connections > edit objects> and check the fields to be included. Verify fields are in the ingestion nodes is the recipe Run the recipe. After finishing the dashboard should open. Issue: Lightning web page 'X' was missing in the tab list. Solution: go to lightning app builder> find Lightning Web Page there, then save>activate After above, add the menu item in the mage desired. Make sure to put all components needed in the 'Studio Hub Components' tab. This includes perm sets, image widgets, dataflow and recipe, dashboards, lightning web pages. Use Case: An international media comglomerate client of mine needs to show certain dashboards to certain people. Due to business rules, groups and roles can't be used--only specific people. So Executive Dashbaord should only be seen by John, Jill BUT not Sam even though all 3 are part of a group or a role or a profile Another dahsboard applies to another set of people,etc.
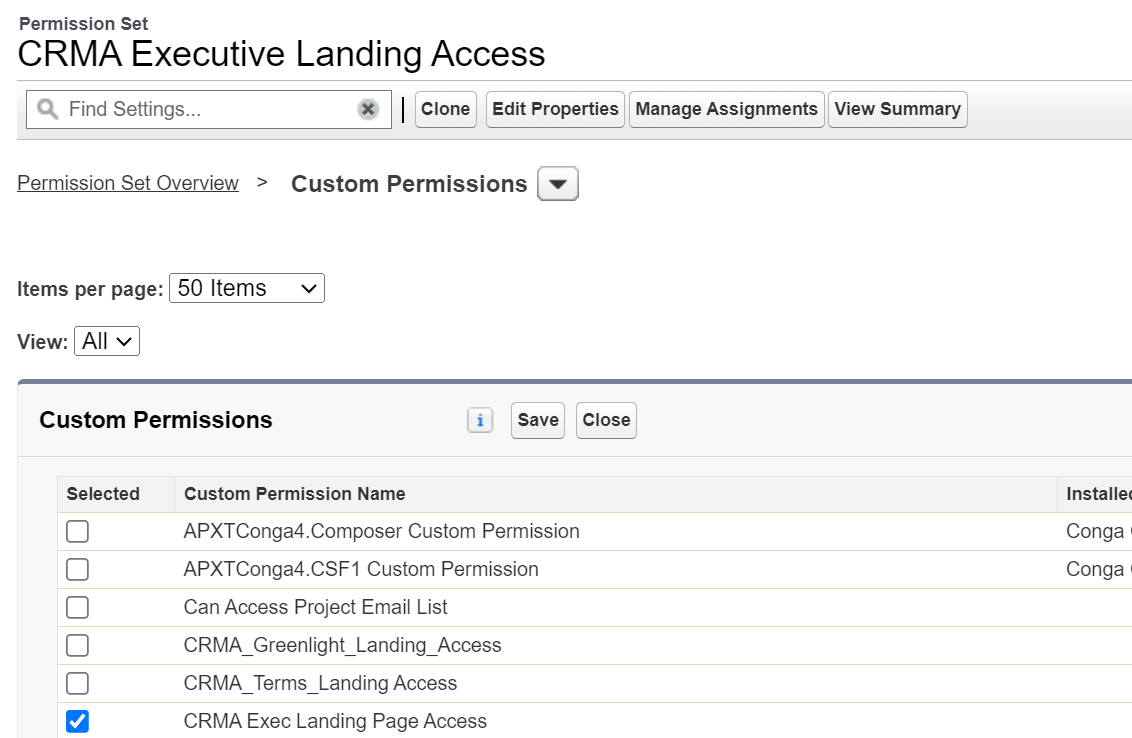
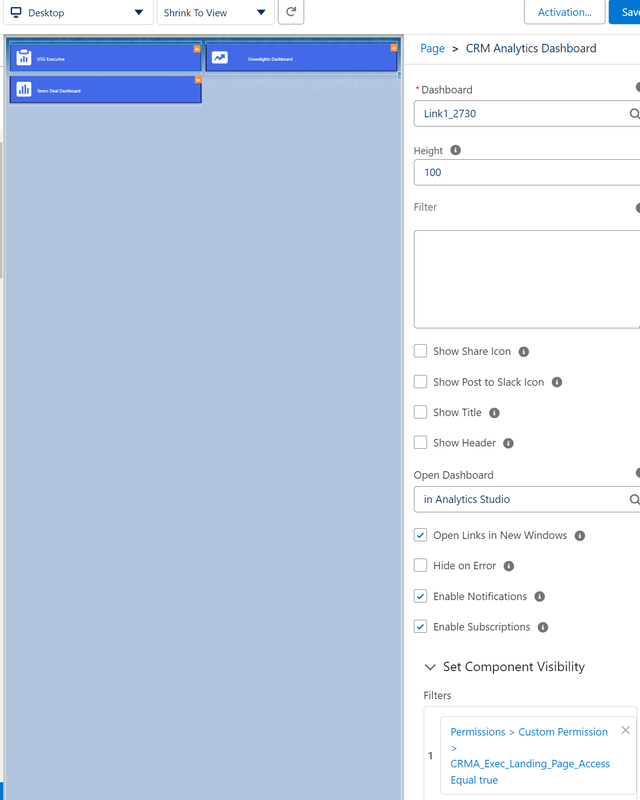
Solution: To achieve this, custom permission sets are used.. These permission sets are then contained inside the 'main' perm set. Assign the custom permission set 'x' to the users allowed to see them using 'manage assignments' in the Settings> User page. Afterwards, drag the dashboard widget onto a lightning web page then use filters for component visibitiy. Use cases for Identity resolution utilizing SFDC Data Cloud:
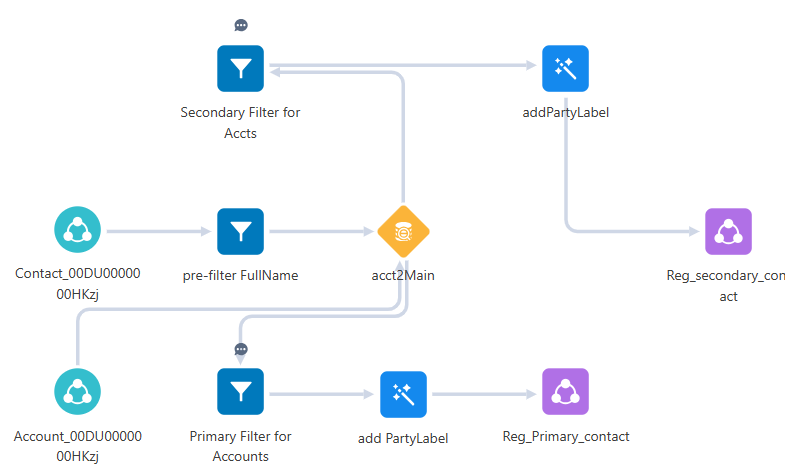
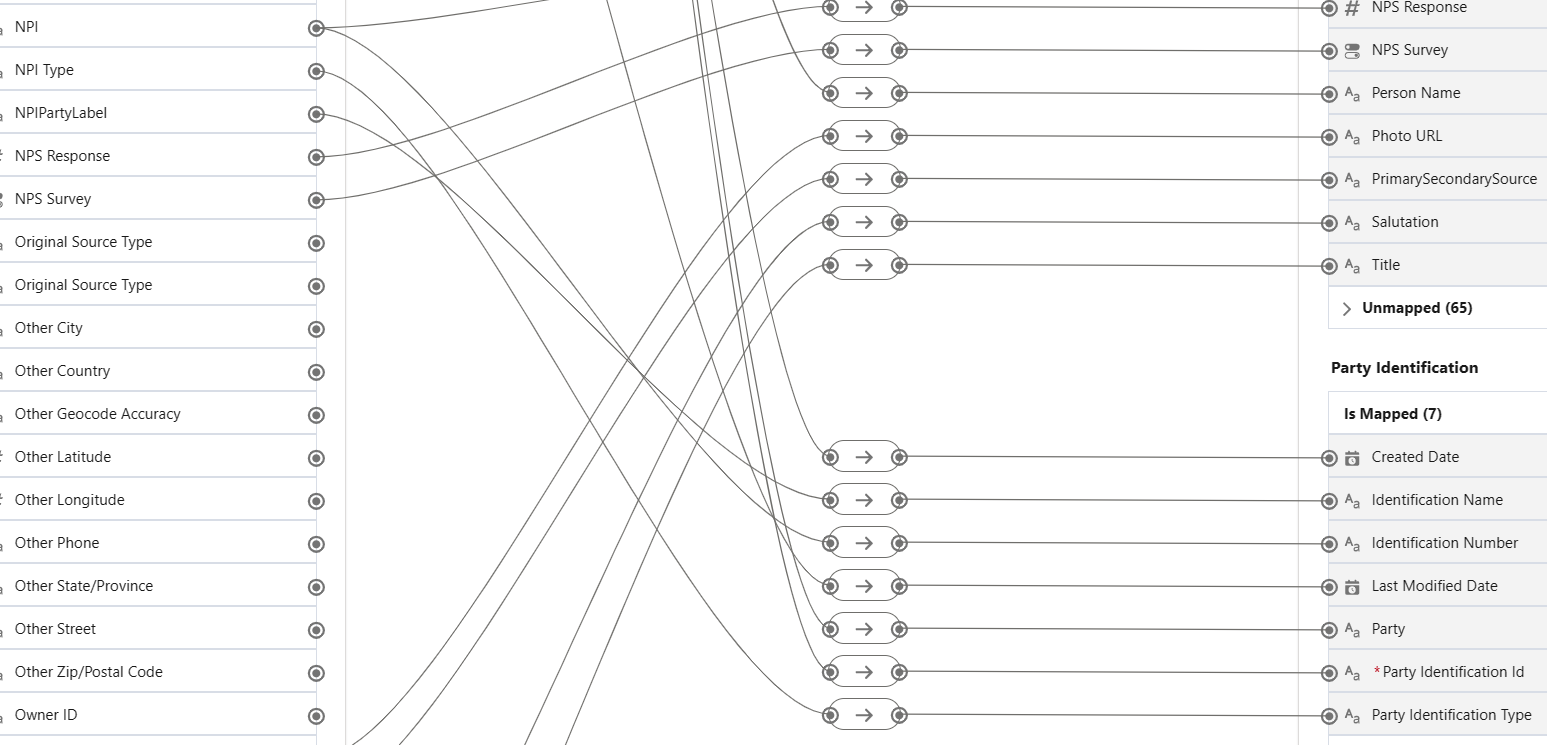
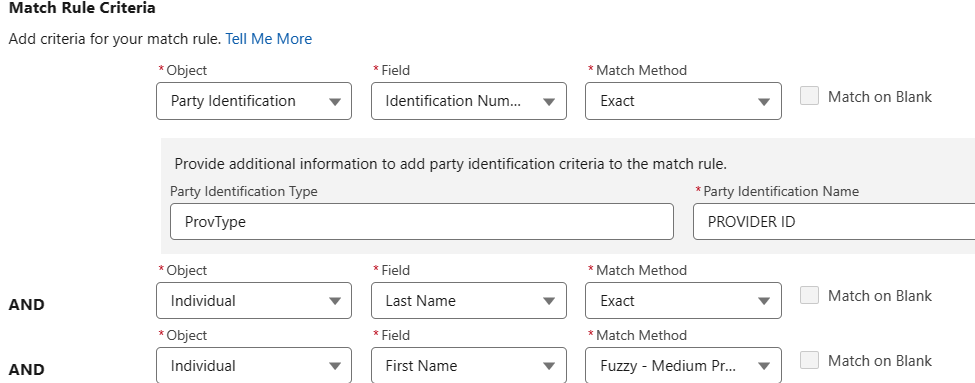
A publicly traded firm of mine needed some help in unifying their client’s Contact profiles. Use Case# 1: They needed to ‘roll’ their contacts that have the same provider ID into a single profile. Example: John Q Public / Provider ID 12345 Jonathan Q. Public / Provider ID = 12345 UNIFIED into 1 Jonathan Q. Public / Provider ID = 12345 Use Care # 2: Surface a unified profile of 2 or more of the same person using the ‘better’ account name and not their generic account that sometimes get assigned to them. Generic accounts such as ‘customer support’ or ‘case account’ are less preferred that actual account names like ‘xyz hospital’ or ‘ABC Radiology Partners,LLC’. Example: Jane Jones / email: [email protected] / Account= ‘Customer Support’ Janet Jones / email: jjones @gmail.com / Account= ‘XYZ Radiology Group’ UNIFIED into 1 Janet Jones / email: jjones @gmail.com / Account= ‘XYZ Radiology Group’ Step1: Ingest the SFDC Contacts Object Step 2: Create a data transformation to separate the ‘primary contacts’ (ie the ones with the better accounts) and the secondary contacts (ie the ones with the less preferred accounts—Customer Support,etc. This is done using a number of filter transformations.(additional filters can be added using ‘or’ logic to filter other bad records like emails having the word ’ ‘test’ on them, etc.) Important—the primary and secondary filters must be mutually exclusive. (ie 1 contact can only belong to one group. Primary Filter: NOT(Account == ’Customer Support’ or email in ’Test’) Secondary Filter: Account==’Customer Support’ or email in ‘Test’ When the data transformation is done, inspect the results using Data Explorer to verify proper binning. For instance, out of let’s say 100,000 Contacts, verify mutual exclusivity—ie 30,000 goes to ‘Primary’ Data Lake Object (DLO) and 70,000 goes to ‘Secondary’ DLO. Create 2 formula fields for the Party Labels to be used in ID resolution. (Node ‘addPartyLabel’ x2 ) Example: Party Identification Type = ‘ProvType’ and Party Identification Name = “PROVIDER ID’ Step 3 : Map both Primary and Secondary DLO’s to ‘Individual’ DMO. IMPORTANT: Make sure to properly map any party identifiers to assist in ID resolutions. Examples of party identifiers are AAA membership, Loyalty Club Numbers, Frequent Flyer Miles Id, Driver’s Licenses, Provider ID’s,etc. Step 4: Create Match rules and other ID resolution parameters and then once done, verify success of the Unified Profile using Data Explorer. Simple case statement to render checks and x's to signify true or false. You can buy a vector image ($5-$20) or use microsoft word and snip the image.
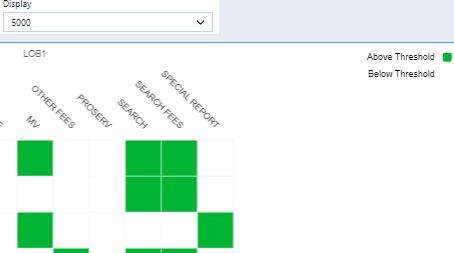
case when ( 'primParentPrtner.Training_Compliance__c'==\"false\") then \"✅\" else \"❌\" end as 'icon' 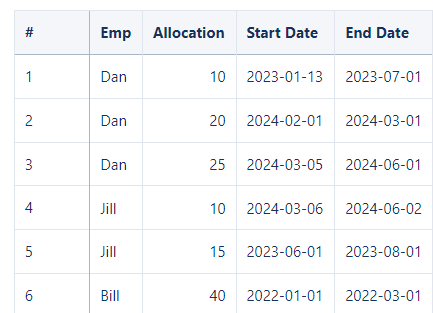 Got a use-case from a cohort looking for help in creating a heat map that shows an employees allocation in hours for a project. In the mockup csv file I created for this POC, we can see that Dan is engaged in a project from Jan 2023 to July 2023 for 10 hours.... engaged in Feb 2024 to March 2024 for 20 hours and so on.....The challenge is that the data only provides the start date and end date which is not a problem for a 2 month engagement. However, Dan's hours need to be on the heatmap for the missing months! In above example he needs a plot for Feb 2023, Mar 2023, april 2023 ...up to July 2023. How? By using the fill() function and some string and data manipulation. The big secret is creating a string called 'concat' that embeds the needed info that will be propagated in the newly generated months by the fill() function. One concaenates thie start,enddates and allocation and name... then 'decodes' it in the next geneate by statements, calcualtes the epoch seconds,etc. A case statement then goes row-by-row to mark the 'busy?' row as true or false if the row is inside the project span. Code: q = load "DanCSV"; --code the concat string to contain important info q = foreach q generate q.'Emp' as 'emp',q.'Allocation',q.'Start_Date_Month',q.'Start_Date_Year',q.'Start_Date_Day',q.'End_Date','Start_Date'+'End_Date'+"!"+'Emp'+"!"+number_to_string('Allocation',"0") as 'concat'; --use the fill function to generate the missing dates q= fill q by (dateCols=('Start_Date_Year','Start_Date_Month','Start_Date_Day',"Y-M-D"), startDate="2023-01-01", endDate="2024-12-31",partition='concat'); --start to decode the concat by getting the Nameindex and allocIndex indices for later use q = foreach q generate 'concat','emp','Start_Date_Year'+"-"+'Start_Date_Month'+"-"+'Start_Date_Day' as 'TopDay',substr('concat',1,10)as 'ProjStart',substr('concat',11,10)as 'ProjEnd',index_of('concat',"!",1,1) as 'NameIndx',index_of('concat',"!",1,2) as 'AllocIndx'; --this 'unpacks'the concat string back into original components. q = foreach q generate 'concat','emp', 'TopDay', 'ProjStart', 'ProjEnd', 'NameIndx', 'AllocIndx','AllocIndx'-'NameIndx'-1 as 'NameLength'; --retrieve the indexes q = foreach q generate 'concat','emp', 'TopDay', 'ProjStart', 'ProjEnd', 'NameIndx', 'AllocIndx','NameLength',substr('concat','NameIndx'+1,'NameLength') as 'NewEmp',substr('concat','AllocIndx'+1) as 'NewAlloc'; ---surface the epoch secords for all the dates q = foreach q generate 'NewEmp', 'TopDay', 'ProjStart', 'ProjEnd', 'NewAlloc',date_to_epoch(toDate('TopDay',"yyyy-MM-dd")) as 'TopDaySec',date_to_epoch(toDate('ProjStart',"yyyy-MM-dd")) as 'ProjStartSec',date_to_epoch(toDate('ProjEnd',"yyyy-MM-dd")) as 'ProjEndSec',month_first_day(toDate('TopDay',"yyyy-MM-dd")) as 'monthFD'; --compare topday to start end dates and flag rows that are within span q = foreach q generate 'NewEmp', 'TopDay', 'ProjStart', 'ProjEnd', 'NewAlloc', 'TopDaySec','ProjStartSec','ProjEndSec', 'monthFD',case when ('TopDaySec'>= 'ProjStartSec' and 'TopDaySec'<= 'ProjEndSec') then "true" else "false" end as 'busy'; --show only busy rows. q2=filter q by 'busy'=="true"; q2 = foreach q2 generate 'NewEmp', 'TopDay', 'ProjStart', 'ProjEnd', 'NewAlloc', 'monthFD','busy'; q2=group q2 by ('NewEmp','monthFD'); q2 = foreach q2 generate 'NewEmp','monthFD' ,string_to_number(min('NewAlloc') ) as 'alloc'; User Story: As a user, I need to know tally any tasks (call, email, meeting, etc) that was done in a certain period. I also want to know whether the source of the email, call,etc was the oppty, account, contact or lead object.
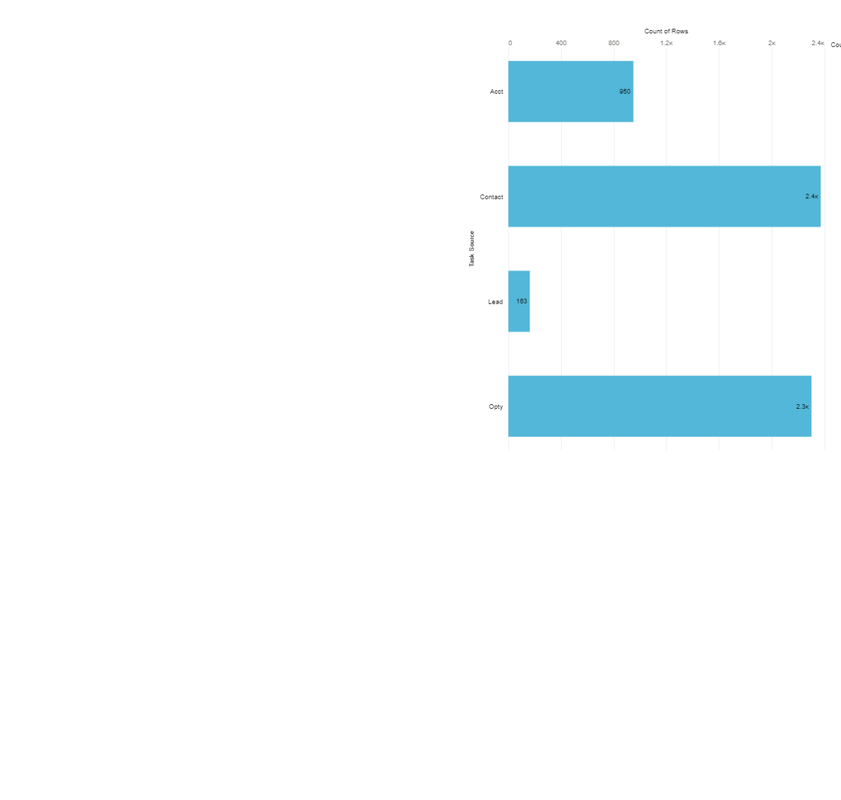
Solution: Ingest the Task and/or Event objects and use the whoId and WhatId fields to join to the above 4. These 2 fields in the task and event are 'polymorphic'-- which means its purpose changes to what object it is connected to. (In object oriented programming, a command 'animal.move' is said to be polymorphic since I means crawl for a snake or fly for a bird.. but I digress). To this point, whatId can either augment to an account or opportunity... WhoId can be augmented to either a lead or a contact. More documentation here from saleForceBen... https://www.salesforceben.com/what-is-the-difference-between-whoid-and-whatid/ After joining the 4 objects into the task (left grain), we can then use a case statement in the recipe to label each row in task--whether the taks is from an oppty, acct, lead or contact. Here is the saql. case when WhoId is null and "opty.Id" is not null then 'Opty' when WhoId is null and "opty.Id" is null then 'Acct' when WhoId is not null and "Lead.Id" is not null then 'Lead' when WhoId is not null and "Lead.Id" is null then 'Contact' end One of the core value proposition of Data Cloud is data harmonization-- a fancy term for consolidating multiple profiles from disparate data sources into a single 'Unified Profile'. Why is this important? Clean data is foundational to effective and accurate AI endeavors. The training data for Machine Learning will be riddled with inaccurate samples, duplicate rows,etc. Simply put..bad data begets bad AI.
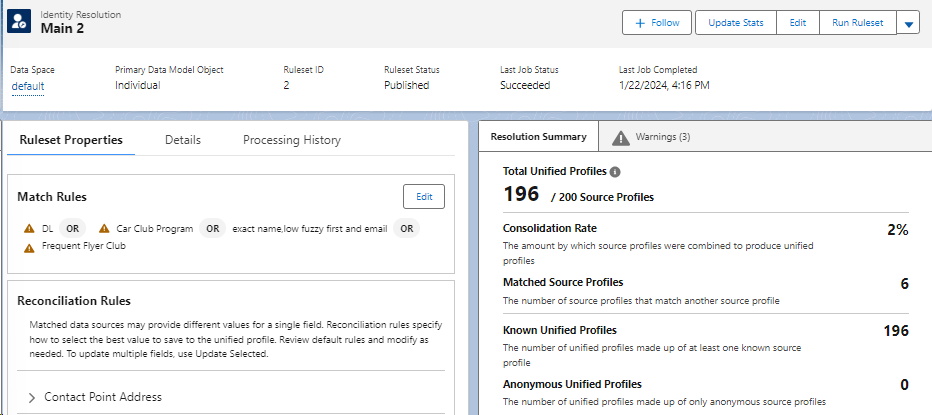
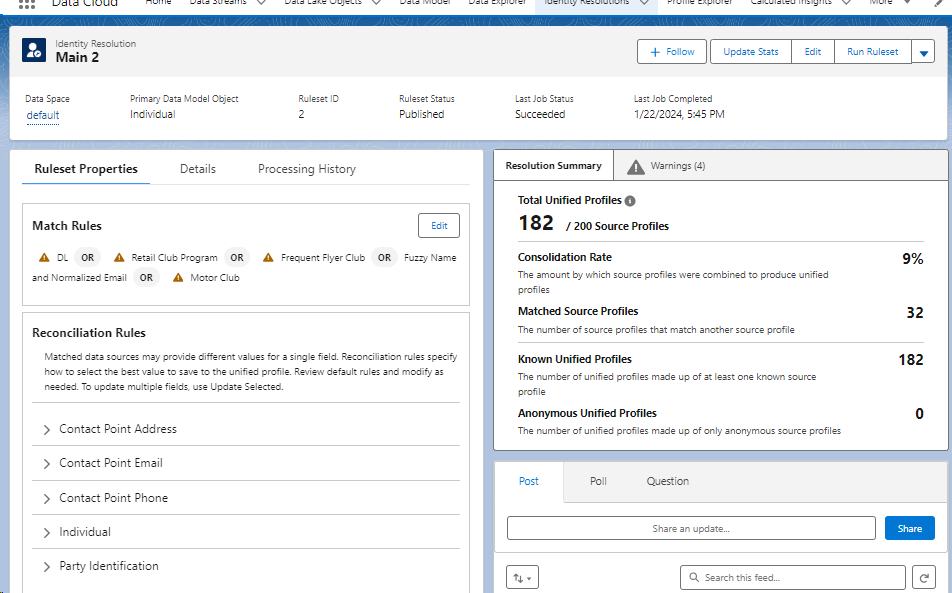
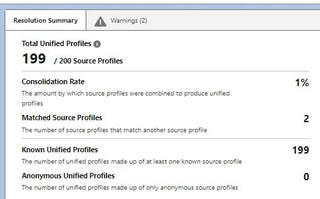
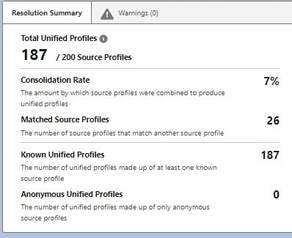
User Story: Company XYZ has an SFDC instance with 3 customers in Contacts -- William Hall (email:[email protected]), William Hall (email: [email protected]) and Will Hall (email:[email protected]). Through proper configuration of Match and Reconciliation rules, Data Cloud (formerly known as Customer Data Platform or CDP) will be able to consolidate the 3 Mr. Halls into the cleaner version consisting of 2 William Halls -- the William Hall with the gmail address and the William Hall with the aol.com address. The match rule that will trigger the above harmonization is 'exact last name+fuzzy first name+exact email' . Additional rules can be layered to this such as 'exact frequent flyer miles' or 'exact driver license number',etc. to further 'unify' profiles-- more rules added means more consolidation (ie increase consolidation rate). The snips below illustrate this... 1st set of snips has 4 match rules -- Driver License (DL) OR car club OR exact last name+email OR frequent flyer. This set unified 200 profiles into 196 . The 2nd set added a 5th match rule 'Motor Club" which means if a person has the exact motor club Id in 1 or more objects involved in the harmonization, they are to be unified into 1 profile. Security Regime for a CRM Analytics Implementation (January 19, 2024)
User Story: • Imagine you are tasked with implementing a robust security strategy for a Salesforce CRM environment. The organization deals with sensitive customer data and requires a secure analytics solution that balances data accessibility with stringent security measures. Assignment Task - Share how you would approach the following: • Data Access Control. • Audit Trail and Monitoring • External Data Source Security. Proposed Solution: Data Access Control - can be achieved by utilizing varying methods or layers in the CRMA environment. It would start with app level security where CRMA asset access can be restricted to a certain group of users. As an example, if business unit “A” should only have access to 3 dashboards, the 3 dashboards (and their underlying datasets) should be saved in an app which is then shared to that group of users. The next aspect of CRMA security is object or field level security. This would involve modifying the object and field access of the integration user and the security user since any attempt to access object and fields not given permission would result in the dataflows failing. This layer can be implemented in place of or in combination with app access layer should the requirements call for object access with restrictions on certain fields for certain groups. The next layer of CRMA is utilizing SFDC’s sharing rules in combination with security predicates. The use of one or both layers would depend on the size of the enterprise and the types of objects to be secured (due to the limitations of the sharing rules). In addition, performance issues might need to be considered since there are overhead costs to using the sharing rules. In terms of security predicates, flatten transformations would be used to ingest the manager hierarchy, the role hierarchy, opportunity teams and other sharing hierarchies (ingested through csv’s) to enforce row-level security requirements. A sharing hierarchy dataset can also be curated. This dataset – which can be refreshed weekly contains the aforementioned hierarchies and ingested into new recipes – an efficient way to streamline the process and replace 4+ nodes with a single node. In addition to the layers above, a superuser category can also be created – achieved by 1) adding a ‘Dataset Access’ field in the user profile, set to let’s say “True” and 2) adding to the recipe transformations a constant ‘ViewAllFlag’ field set to “True” . This would enable a certain category of users to bypass the security restrictions and have complete access to the CRMA datasets/assets. Examples of these personas would be external ad-hoc CRMA developers, or senior people that manages business units not adequately expressed by existing role hierarchies. An example of a security predicate which makes rows available only to opportunity leaders, opportunity owners, account owners, managers of the owners, users belonging in the roles hierarchy and superusers. 'OpportunityId.Opportunity_Leader__c' == "$User.Id" || 'OwnerId.Id' == "$User.Id" || 'Account.OwnerId' == "$User.Id" || 'OwnerId.ManagerMulti' == "$User.Id" || 'OwnerId.UserRoleId.Roles' == "$User.UserRoleId" || 'ViewAllFlag' == "$User.Dataset_Access__c" Once all these layers of CRMA get implemented, the CRMA admin will need to test the layers by assuming different identities and checking if the asset access, object/field and row level controls work as defined. Audit Trail and Monitoring - Monitoring the security regime discussed would involve subscribing to external tools to track changes in the security predicates.This is so because security predicate changes are not logged in the SFDC audit log. * Change data capture (CDC) 3rd party tools are available which captures changes to SFDC data such as
*https://trailhead.salesforce.com/trailblazer-community/feed/0D54S00000HDtugSAD In addition to monitoring changes to the predicates, the sharing hierarchy dataset has to be refreshed periodically to track users that have been activated / deactivated in the user object. External Data Source Security - can be implemented by either pre-filtering the data rows before synching it into CRMA (using connectors) or post-filtering them after it gets synched. There are performance issues and generalizability of use factors to be considered in deciding which method to use.
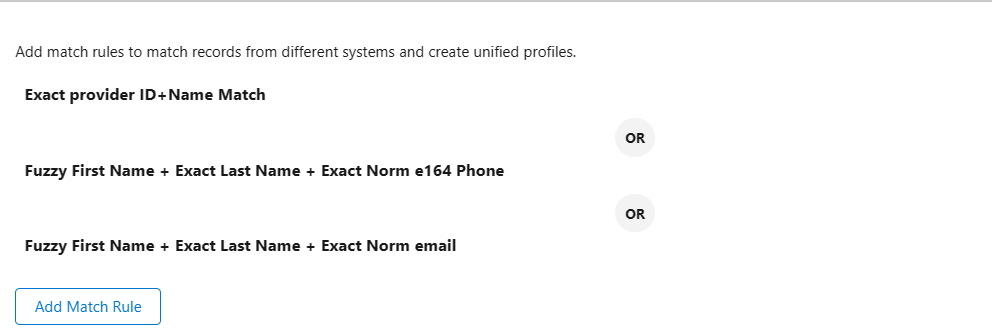
One of the important benefits of Data Cloud is its ability to unify profiles the exist in multiple data sources. Using rulesets, a user can create match rules which act as criteria for deciding whether data from one object ought to be 'unified' with data from another object(s). (eg. row from marketing cloud consolidated with a row from service cloud into a new unified profile object). Many match rules can be created which, when chained together become a giant filter having 'or' logic. This means that if rows between objects satisfy any of the chained rules, then those rows are deemed to be a match. Imagine if there a a total of 500 rows from 3 objects and Data Cloud Admin determines that rows with matching last names with identical emails be deemed a match (criteria 1), then adds 2 more criterias-- say... same pasport numbers (Criteria 2) and same Drivers license numbers(Criteria 3)...after running the identity resolution process, it results in 500 rows being unified into 400 rows in the unified profile object.This results in a consolidation rate of 20% (1 - 400 / 500). During UAT, the end-users think that the 3 criterias were too aggressive in defining what constitutes a match, the Admin then can takes off the 2 criterias and find that 500 rows only gets unified into 490 rows which results in a 2% consolidation ( 1 - 490 / 500).Intuitively it makes sense...the less criterias, the stricter the rules, the lower the consolidation rate. The more criterias, the looser the rules (remember its using OR logic not AND) , the higher the consolidation rate.Snipped above are 2 rulesets--the one on the left only had 1 criteria, the one on the right had 4 criterias.
User Story: User needs to see how oppty pipeline differs between two dates. Step 1 involves creating a recipe to run once daily and snaphost the values of the oppty object.(or oli if need more details).. Step 2. Create a dashboard with 2 dates and render oppty by state using multi datastreams. Code below shows data stream and 2 queries which feed the pipeline snapshot dates.. ie today and 1 year back.
Results qry to calc 1 yr back: q= load "zds_completeOpptys_v2"; q = filter q by date('SnapshotStamp_Year', 'SnapshotStamp_Month', 'SnapshotStamp_Day') in ["366 days ago".."365 days ago"]; q= group q by 'SnapshotStamp'; q = foreach q generate 'SnapshotStamp' as 'sd', substr('SnapshotStamp',2,10) as 'sd2';q=order q by 'sd' desc; q=limit q 1; for today q = load "zds_completeOpptys_v2"; q = filter q by date('SnapshotStamp_Year', 'SnapshotStamp_Month', 'SnapshotStamp_Day') in ["current day".."current day"]; q= group q by 'SnapshotStamp'; q = foreach q generate 'SnapshotStamp' as 'topDay', substr('SnapshotStamp',2,10) as 'topDayStr'; q=limit q 1; comparos of 2 snap dates "query": "q = load \"zds_completeOpptys_v2\";\nq=filter q by 'Region' !=\"International\";\nq = filter q by !('AccountOwner' in [\"Integration User\",\"Integration User2\"]);\nq1 = filter q by {{column(timeStampText_4.selection,[\"Snapshot1\"]).asEquality('timeStampText')}};\nq1 = filter q1 by date('CloseDate_Year', 'CloseDate_Month', 'CloseDate_Day') in {{cell(static_2.selection,0,\"Valu\").asString()}};\nq2 = filter q by {{column(timeStampText_5.selection,[\"Snapshot2\"]).asEquality('timeStampText')}};\nq2 = filter q2 by date('CloseDate_Year', 'CloseDate_Month', 'CloseDate_Day') in {{cell(q_FY2_1.selection,0,\"Valu\").asString()}};\nresult = group q1 by '{{column(static_1.selection, [\"Valu\"]).asObject()}}' full, q2 by '{{column(static_1.selection, [\"Valu\"]).asObject()}}' ;\nresult = foreach result generate coalesce(q1.'{{column(static_1.selection, [\"Valu\"]).asObject()}}', q2.'{{column(static_1.selection, [\"Valu\"]).asObject()}}' ) as '{{column(static_1.selection, [\"Valu\"]).asObject()}}', round(sum(q1.'Amt'),0) as 'Pipeline1 Amt',round(sum(q2.'Amt'), 0) as 'Pipeline2 Amt', round((sum(q1.'Amt')- sum(q2.'Amt')), 0) as 'Difference';\nresult = order result by ('{{column(static_1.selection, [\"Valu\"]).asObject()}}'asc);\nq3 = filter q by {{column(timeStampText_4.selection,[\"Snapshot1\"]).asEquality('timeStampText')}};\nq3 = filter q3 by date('CloseDate_Year', 'CloseDate_Month', 'CloseDate_Day') in {{cell(static_2.selection,0,\"Valu\").asString()}};\nq4 = filter q by {{column(timeStampText_5.selection,[\"Snapshot2\"]).asEquality('timeStampText')}};\nq4 = filter q4 by date('CloseDate_Year', 'CloseDate_Month', 'CloseDate_Day') in {{cell(q_FY2_1.selection,0,\"Valu\").asString()}};\ntot = cogroup q3 by all full,q4 by all;\ntot = foreach tot generate \"--------- TOTALS --------- \" as '{{column(static_1.selection, [\"Valu\"]).asObject()}}' , round(sum(q3.'Amt'),0) as'Pipeline1 Amt', round(sum(q4.'Amt'),0) as 'Pipeline2 Amt', round((sum(q3.'Amt')- sum(q4.'Amt')), 0) as 'Difference';\nfinal =union result, tot;\n", q = load "x_pokeOppty";
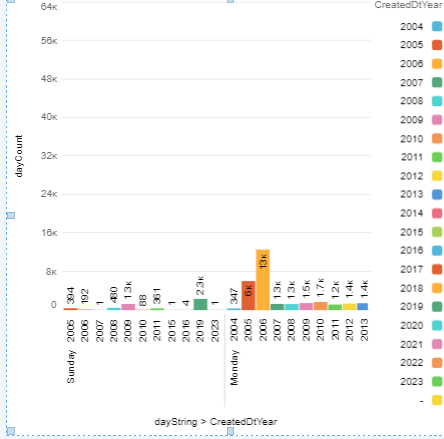
q = foreach q generate q.'mv_prod.ProductCode' as 'mv_prod.ProductCode', q.'Gross_Margin_Dollars__c' as 'Gross_Margin_Dollars__c','Acct.CreatedDate' as 'Acct.CreatedDate',day_in_week(toDate('Acct.CreatedDate_sec_epoch')) as 'DayCreated','Acct.CreatedDate_Year' as 'CreatedDtYear'; q = foreach q generate 'mv_prod.ProductCode', 'Gross_Margin_Dollars__c','Acct.CreatedDate', 'DayCreated','CreatedDtYear',case when ('DayCreated'==1) then "Sunday"when ('DayCreated'==2) then "Monday" when ('DayCreated'==3) then "Tuesday" when ('DayCreated'==4) then "Wednesday" when ('DayCreated'==5) then "Thursday" when ('DayCreated'==6) then "Friday" when ('DayCreated'==7) then "Saturday" end as 'dayString'; q= group q by ('dayString','DayCreated','CreatedDtYear'); q=foreach q generate 'DayCreated' as 'DayCreated','dayString' as 'daystring', 'CreatedDtYear', count() as 'dayCount'; q=order q by 'DayCreated' ; Value Display sortpivots sort measures
1 User_Division__x Team | Owner | Region -- 2Initial Call Initial Call - -- 3Initial Call - Yes Schedule Meeting Initial Call - Yes Schedule Meeting - --  Here is a sample of a table widget with totals with bindings used to sort meaures or dimensions (since faceting is needed to facilitate interactivity of dashboards). Projections need their API names vs. string labeling. Snip is pseudocode(almost) q = load "Activities"; q_A = filter q by 'Type_of_Call__c' == "Proposal Revision" && 'Proposal_Meeting_Result__c' in ["Maybe - Revise Proposal", "No - Create New Activity", "Yes - Deal is Closed Won!"]; q_B = filter q by 'Type_of_Call__c' == "Proposal Revision" && 'Proposal_Meeting_Result__c' == "Yes - Deal is Closed Won!"; q_C = filter q by 'Type_of_Call__c' == "Initial Call" && 'Result_of_Call__c' in ["CFA, Successful", "No, Successful", "No, Unsuccessful", "Yes, Schedule Meeting"];q_A = group q_A by rollup('{{cell(static_3.selection, 0, "Value").asObject()}}'); q_A = order q_A by ('{{cell(static_3.selection, 0, "Value").asObject()}}' asc nulls first); q_B = group q_B by rollup('{{cell(static_3.selection, 0, "Value").asObject()}}'); q_B = order q_B by ('{{cell(static_3.selection, 0, "Value").asObject()}}' asc nulls first); q_C = group q_C by rollup('{{cell(static_3.selection, 0, "Value").asObject()}}'); q_C = order q_C by ('{{cell(static_3.selection, 0, "Value").asObject()}}' asc nulls first); result = group q_A by '{{cell(static_3.selection, 0, "Value").asObject()}}' full, q_B by '{{cell(static_3.selection, 0, "Value").asObject()}}' full, q_C by '{{cell(static_3.selection, 0, "Value").asObject()}}'; result = foreach result generate coalesce(q_A.'{{cell(static_3.selection, 0, "Value").asObject()}}', q_B.'{{cell(static_3.selection, 0, "Value").asObject()}}', q_C.'{{cell(static_3.selection, 0, "Value").asObject()}}', sum(q_A.'ActivityCount') as 'Proposal Revision', sum(q_B.'ActivityCount') as 'Proposal Revision Yes - Deal is Closed Won!', sum(q_C.'ActivityCount') as 'Initial Call', coalesce(grouping(q_A.'{{cell(static_3.selection, 0, "Value").asObject()}}'), grouping(q_B.'{{cell(static_3.selection, 0, "Value").asObject()}}'), grouping(q_C.'{{cell(static_3.selection, 0, "Value").asObject()}}'))) as 'grouping_{{cell(static_3.selection, 0, "Value").asObject()}}'; result = foreach result generate '{{cell(static_3.selection, 0, "Value").asObject()}}', 'Initial Call', 'Initial Call - Yes Schedule Meeting', 'Initial Call - Yes Schedule Meeting' / 'Initial Call' as 'Yes, Schedule Meeting', 'Presentation Meeting', 'Yes, Quote it - Presentation Meeting' , 'Yes, Quote it - Presentation Meeting' / 'Presentation Meeting' as 'Ratio - Yes Quote it','grouping_{{cell(static_3.selection, 0, "Value").asObject()}}'; summary = filter result by 'grouping_{{cell(static_3.selection, 0, "Value").asObject()}}' == 1; result = filter result by 'grouping_{{cell(static_3.selection, 0, "Value").asObject()}}' == 0; HERE IS SORTING BINDINGS THRU TOGGLES First binding'switch' {{cell(columnList_1.selection, 0, "sortPivots").asObject()}}result = order result by ('{{cell(columnList_1.selection, 0, "valu").asObject()}}' {{cell(sorter_1.selection, 0, "valu").asObject()}} nulls last); 2nd binding 'switch' {{cell(columnList_1.selection, 0, "sortMeasures").asObject()}} result = order result by ('{{cell(static_3.selection, 0, "Value").asObject()}}' {{cell(sorter_1.selection, 0, "valu").asObject()}} nulls last); result = union result, summary; SAQL resolves to …. q = load "0Fb5x000000ToKGCA0/0Fc5x000007ZFMjCAO"; q_A = filter q by 'Type_of_Call__c' == "Proposal Revision" && 'Proposal_Meeting_Result__c' in ["Maybe - Revise Proposal", "No - Create New Activity", "Yes - Deal is Closed Won!"]; q_B = filter q by 'Type_of_Call__c' == "Proposal Revision" && 'Proposal_Meeting_Result__c' == "Yes - Deal is Closed Won!"; q_C = filter q by 'Type_of_Call__c' == "Initial Call" && 'Result_of_Call__c' in ["CFA, Successful", "No, Successful", "No, Unsuccessful", "Yes, Schedule Meeting"]; q_A = group q_A by rollup('User_Division__c'); q_A = order q_A by ('User_Division__c' asc nulls first); q_B = group q_B by rollup('User_Division__c'); q_B = order q_B by ('User_Division__c' asc nulls first); q_C = group q_C by rollup('User_Division__c'); q_C = order q_C by ('User_Division__c' asc nulls first); result = group q_A by 'User_Division__c' full, q_B by 'User_Division__c' full, q_C by 'User_Division__c' ; result = foreach result generate c oalesce(q_A.'User_Division__c', q_B.'User_Division__c', q_C.'User_Division__c') as 'User_Division__c', sum(q_A.'ActivityCount') as 'Proposal Revision', sum(q_B.'ActivityCount') as 'Proposal Revision Yes - Deal is Closed Won!', sum(q_C.'ActivityCount') as 'Initial Call', coalesce(grouping(q_A.'User_Division__c'), grouping(q_B.'User_Division__c'), grouping(q_C.'User_Division__c')) as 'grouping_User_Division__c'; result = foreach result generate 'User_Division__c', 'Initial Call', 'Initial Call - Yes Schedule Meeting', 'Initial Call - Yes Schedule Meeting' / 'Initial Call' as 'Yes, Schedule Meeting'…etc ,'grouping_User_Division__c'; summary = filter result by 'grouping_User_Division__c' == 1; result = filter result by 'grouping_User_Division__c' == 0; --result = order result by ('User_Division__x' asc nulls last); result = order result by ('User_Division__c' asc nulls last); result = union result, summary; Prep Work:
Create 2 apps in CRM Analytics -- one to contain to contain new / modified work for UAT testing (PreProd Testing) and another to contain archived copies (Archived Dashboards). Additional apps may be created to contain the same assets as it moves though varying stages of approval. (example: PreProd > UAT Testing > Archive)
Production Deployment:
Example: User Story 1234 requests a color change and 2 additional filters for the 'Top Accounts' (Dashboard ID 1) contained in the Sales Analytics app.
'Top Accounts_post_1234' (ID 3) > Archived Dashboards 'Top Accounts' (ID 2) > Sales Analytics. q_b = load "0Fb1T000000ob0mSAA/0Fc1T000006fBb4SAE";
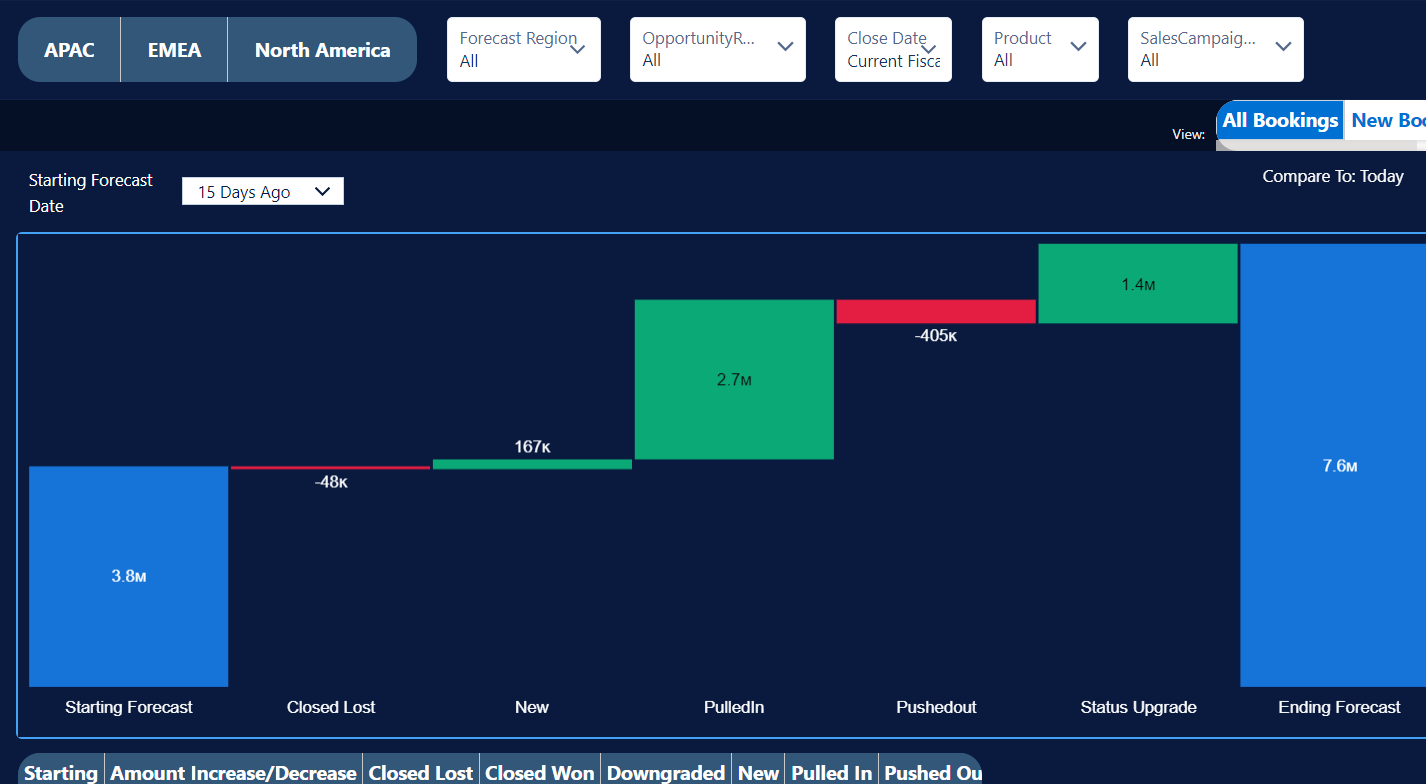
q_a = load "0Fb1T000000bmx9SAA/0Fc1T000006fHN3SAM"; q_a=filter q_a by !('StageHGI' in ["Dormant", "Duplicate"]); q_b=filter q_b by 'OpportunityRecordType.Name' in ["Renewal Business - FRR","Cross-sell - FRR", "New Business - FRR", "Upsell/Add-On - FRR"]; q_b= filter q_b by date('Snapshot_Date_Year', 'Snapshot_Date_Month', 'Snapshot_Date_Day') in ["15 days ago".."15 days ago"]; q_a=filter q_a by 'RecordType.Name' in ["Renewal Business - FRR","Cross-sell - FRR", "New Business - FRR", "Upsell/Add-On - FRR"]; --q_a = foreach q_a generate 'Id' as 'Id','StageHGI' as 'StageHGI', case when ( 'StageHGI' == "Closed Won") then "Closed Won" when ('StageHGI' == "Closed Lost") then "Closed Lost" when('Deal_Status_MASTER__c' != "Forecast") then "Non Forecast" else "ok" end as 'Bins','TotalAACV' as 'TotalAACV', 'CloseDate' as 'CloseDate', case when date( 'CloseDate_Year','CloseDate_Month', 'CloseDate_Day') in ["current fiscal_quarter".."current fiscal_quarter"] then "ValidDt" else "InvalidDate" end as 'DateFilterA',case when 'RecordType.Name' == "Renewal Business - FRR" then 'TotalAACV' - 'AACV__c' else 'TotalAACV' end as 'RealAACV'; q_a = foreach q_a generate 'Id' as 'Id','StageHGI' as 'StageHGI', case when ('StageHGI' == "Closed Won") then "Closed Won" when ('StageHGI' == "Closed Lost") then "Closed Lost" when ('Deal_Status_MASTER__c' != "Forecast") then "Non Forecast" else "ok" end as 'Bins','TotalAACV' as 'RealAACV', 'CloseDate' as 'CloseDate', case when date( 'CloseDate_Year','CloseDate_Month', 'CloseDate_Day') in ["current fiscal_quarter".."current fiscal_quarter"] then "ValidDt" else "InvalidDate" end as 'DateFilterA'; res_a= foreach q_a generate 'Id' as 'Id','StageHGI' as 'StageHGI', 'Bins' as 'Bins','RealAACV' as 'RealAACV', 'CloseDate' as 'CloseDate', 'DateFilterA' as 'DateFilterA'; --q_b = foreach q_b generate 'Id' as 'Id','Snapshot_Date' as 'snapB','Bins' as 'Bins','TotalAACV' as 'TotalAACV', 'CloseDate' as 'CloseDate', case when date( 'CloseDate_Year','CloseDate_Month', 'CloseDate_Day') in ["current fiscal_quarter".."current fiscal_quarter"] then "ValidDt" else "InvalidDate" end as 'DateFilterB',case when 'OpportunityRecordType.Name' == "Renewal Business - FRR" then 'TotalAACV' - 'AACV__c' else 'TotalAACV' end as 'RealAACV'; q_b = foreach q_b generate 'Id' as 'Id','Snapshot_Date' as 'snapB','Bins' as 'Bins','TotalAACV' as 'RealAACV', 'CloseDate' as 'CloseDate', case when date( 'CloseDate_Year','CloseDate_Month', 'CloseDate_Day') in ["current fiscal_quarter".."current fiscal_quarter"] then "ValidDt" else "InvalidDate" end as 'DateFilterB'; res_b= foreach q_b generate 'Id' as 'Id','snapB' as 'snapB','Bins' as 'Bins','RealAACV' as 'RealAACV', 'CloseDate' as 'CloseDate', 'DateFilterB' as 'DateFilterB'; combo = group res_a by 'Id' full, res_b by 'Id'; combo= foreach combo generate res_a.'Id' as 'Id',first(res_a.'StageHGI') as 'StageHGI', sum(res_a.'RealAACV') as 'AmtA', first(res_a.'CloseDate') as 'CloseDateA', first(res_a.'DateFilterA' )as 'DateFilterA',first(res_a.'Bins') as 'BinA', first(res_b.'Bins') as 'BinB',first(res_b.'DateFilterB' )as 'DateFilterB', sum(res_b.'RealAACV') as 'AmtB', first(res_b.'CloseDate') as 'CloseDateB'; combo2= foreach combo generate 'Id' as 'Id', 'AmtA' as 'AmtA', 'CloseDateA' as 'CloseDateA', 'DateFilterA' as 'DateFilterA', 'BinA' as 'BinA', 'BinB' as 'BinB', 'DateFilterB' as 'DateFilterB', 'AmtB' as 'AmtB','CloseDateB' as 'CloseDateB', coalesce((case when 'BinB' !="ok" and 'DateFilterA'=="ValidDt" and 'BinA' =="ok" then 'AmtA' when 'BinB' =="ok" and DateFilterB =="InvalidDate" and 'DateFilterA' == "ValidDt" and 'BinA' == "ok" then 'AmtA' when ('BinB' is null and 'DateFilterA'=="ValidDt" and 'BinA' =="ok") then 'AmtA' when ('BinB' == "ok" and 'DateFilterB'=="ValidDt" and 'BinA' =="ok" and 'DateFilterA' =="ValidDt" and 'AmtA' !='AmtB') then ('AmtA' -'AmtB') when ('BinB' == "ok" and 'DateFilterB'=="ValidDt" and 'BinA' == "Closed Won") then 'AmtB' * (-1) when ('BinB' == "ok" and 'DateFilterB'=="ValidDt" and 'BinA' =="Closed Lost") then 'AmtB' * (-1) when ('BinB' == "ok" and 'DateFilterB' == "ValidDt" and 'DateFilterA'== "InvalidDate") then 'AmtB' * (-1) when ('BinB' == "ok" and 'DateFilterB' == "ValidDt" and 'DateFilterA' != "InvalidDate" and 'BinA' != "ok") then 'AmtB' * (-1)end),0) as 'Adjustments', (case when 'BinB' !="ok" and 'DateFilterA'=="ValidDt" and 'BinA' =="ok" then "Status Upgrade" when 'BinB' =="ok" and DateFilterB =="InvalidDate" and 'DateFilterA' == "ValidDt" and 'BinA' == "ok" then "PulledIn" when ('BinB' is null and 'DateFilterA' == "ValidDt" and 'BinA' =="ok") then "New" when 'BinB' =="ok" and 'DateFilterB' =="ValidDt" and 'BinA' =="ok" and 'DateFilterA' =="ValidDt" and 'AmtA' !='AmtB' then "Amt Inc or Dec" when ('BinB' =="ok"and 'DateFilterB'=="ValidDt" and 'BinA' == "Closed Won") then "Closed Won" when ('BinB' =="ok"and 'DateFilterB'=="ValidDt" and 'BinA' =="Closed Lost") then "Closed Lost" when ('BinB' == "ok" and 'DateFilterB' == "ValidDt" and 'DateFilterA' == "InvalidDate") then "Pushedout" when ('BinB' == "ok" and 'DateFilterB' == "ValidDt" and 'DateFilterA' != "InvalidDate" and 'BinA' != "ok") then "Downgraded" end) as 'AdjCode'; combo3 = group combo2 by 'AdjCode'; combo3 = foreach combo3 generate 'AdjCode' as 'AdjCode', sum('Adjustments') as 'Adjustments'; combo4 = filter combo3 by 'Adjustments' != 0; combo4 = group combo4 by 'AdjCode'; combo4 = foreach combo4 generate 'AdjCode' as 'AdjCode', sum('Adjustments') as 'Adjustments'; snap1 = filter combo by 'BinB' =="ok" and 'DateFilterB' =="ValidDt"and !('StageHGI' in["Dormant","Duplicate"]); snap1=group snap1 by all; snap1 = foreach snap1 generate "Starting Forecast" as 'AdjCode', sum('AmtB') as 'Adjustments'; snap2 = filter combo by 'BinA'=="ok" and 'DateFilterA' == "ValidDt"; snap2= group snap2 by all; snap2 = foreach snap2 generate "Ending Forecast" as 'AdjCode', sum('AmtA') as 'Adjustments'; finalRes = union snap1,combo4, snap2; Links is a CRMA widget class that is used to navigate between url's, pages, and layouts. The default of this widget is a button . However, one can also use images embedded in a container to 'house' links. In this use-case, we will be using 2 links-- Link # 1 to go from page 1 to page 2 . This link#1 is located in page 1. Link # 2 to go from page 2 back to page 1. This link#2 located in page 2. Step 1: drag container #1 in page 1, pick "deselect " file as its background image. Step 2: drag a link and maximize it inside container. Make it invisible by widget style>background color>custom and slide color all the way to left. Fill out the 'Link to' dialogue boxes to go from page 1 to page 2. Step 3: go to page 2, drag container#2,pick 'selected' file as its background image. Step 4: drag a link and maximize it inside container #2 Make it invisible by widget style>background color>custom and slide color all the way to left. Fill out the 'Link to' dialogue boxes to go from page 2 to page 1. Step 5: drop a text field next to the 2 containers to label buttons appropriately. "Show Page 2" and "Show page1" Snip below shows 'deselect' and 'select' images . "filterpanel_3": {
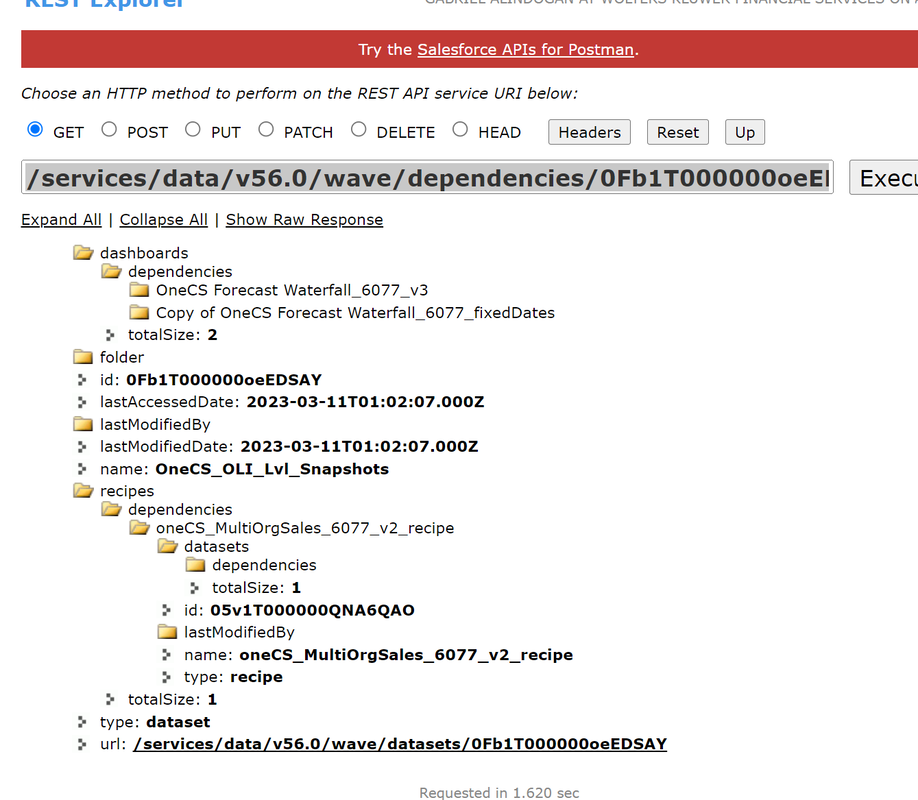
"parameters": { "filterItemOptions": { "propertyColor": "#091A3E", "valueColor": "#16325C" }, "filters": [ { "dataset": { "name": "zds_OpptyLineItemNew" }, "field": "insideOutsideUserField" } ], "itemsPerRow": 1, "showAllFilters": false, "title": { "separatorColor": "#E6ECF2", "text": { "align": "left", "color": "#091A3E", "fontSize": 16, "label": "Inside or Field Sales" }, "visible": true } }, "type": "filterpanel" }, "listselector_12": { "parameters": { "compact": false, "displayMode": "combo", Using the GET method in workbench enables user to retrieve the dependencies of CRMA assets. Snip below shows a retrieval of connected dependencies of a dataset. Here you see that the dataset with id of 0Fb1T0000oE....... has the following dashboards, recipes and app.
|
|
Site powered by Weebly. Managed by Hostwinds

