|
q = load \"zds_OpptySnapshot\";\nq1 = filter q by {{column(timeStampText_4.selection,[\"Snapshot1\"]).asEquality('timeStampText')}};\nq1 = filter q1 by date('CloseDate_Year', 'CloseDate_Month', 'CloseDate_Day') in {{cell(static_2.selection,0,\"Valu\").asString()}};\nq2 = filter q by {{column(timeStampText_5.selection,[\"Snapshot2\"]).asEquality('timeStampText')}};\nq2 = filter q2 by date('CloseDate_Year', 'CloseDate_Month', 'CloseDate_Day') in {{cell(q_FY2_1.selection,0,\"Valu\").asString()}};\nresult = group q1 by 'Stage' full, q2 by 'Stage';\nresult = foreach result generate coalesce(q1.'Stage', q2.'Stage') as 'Stage', number_to_string(sum(q1.'Amt'), \"$#,####\") as 'Snapshot1 Amt',number_to_string(sum(q2.'Amt'), \"$#,####\") as 'Snapshot2 Amt', number_to_string((sum(q1.'Amt')- sum(q2.'Amt')), \"$#,####\") as 'Difference';\nresult = order result by ('Stage' asc);\nq3 = filter q by {{column(timeStampText_4.selection,[\"Snapshot1\"]).asEquality('timeStampText')}};\nq3 = filter q3 by date('CloseDate_Year', 'CloseDate_Month', 'CloseDate_Day') in {{cell(static_2.selection,0,\"Valu\").asString()}};\nq4 = filter q by {{column(timeStampText_5.selection,[\"Snapshot2\"]).asEquality('timeStampText')}};\nq4 = filter q4 by date('CloseDate_Year', 'CloseDate_Month', 'CloseDate_Day') in {{cell(q_FY2_1.selection,0,\"Valu\").asString()}};\ntot = cogroup q3 by all full,q4 by all;\ntot = foreach tot generate \"Totals\" as 'Stage', number_to_string(sum(q3.'Amt'), \"$#,####\") as'Snapshot1 Amt', number_to_string(sum(q4.'Amt'), \"$#,####\") as 'Snapshot2 Amt', number_to_string((sum(q3.'Amt')- sum(q4.'Amt')), \"$#,####\") as 'Difference';\nfinal =union tot,result;\n",
"receiveFacetSource": {
0 Comments
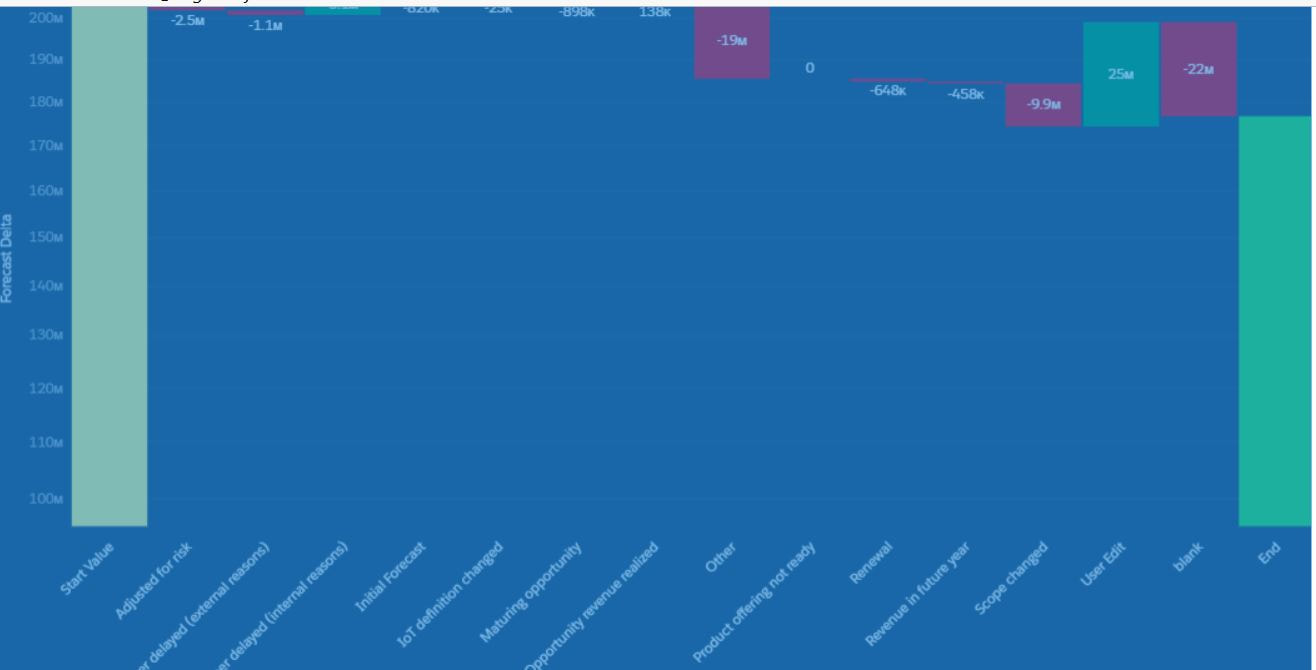
So let's say you are able to plot out an object through time using a dataflow loop. You would have a set of data (eg. a snapshot of open opportunities every day that runs every 5am.) In addition to plotting this time-series, you want to plot changes from snapshot Date1 to snapshot Date 2 grouped by a certain field like per zip code, or region, or business unit,etc.
Below is a snip of the waterfall chart and its SAQL q = load \"zds_IoTForecast5\";\nstartVal = filter q by {{column(qDateTest_1.selection,[\"cTimeStampText\"]).asEquality('cTimeStampText')}};\nendVal = filter q by {{column(q_SnapDate2_1.selection,[\"cTimeStampText\"]).asEquality('cTimeStampText')}};\nq_A = filter q by {{column(qDateTest_1.selection,[\"cTimeStampText\"]).asEquality('cTimeStampText')}};\nq_B = filter q by {{column(q_SnapDate2_1.selection,[\"cTimeStampText\"]).asEquality('cTimeStampText')}};\nstartVal = group startVal by all;\nstartVal = foreach startVal generate \"Start Value\" as '{{column(static_6.selection,[\"Valu\"]).asObject()}}',number_to_string(sum (startVal.'TotValueUSD'),\"$#,###\") as 'Forecast Delta';\nendVal = group endVal by all;\nresult = group q_A by '{{column(static_6.selection,[\"Valu\"]).asObject()}}' full, q_B by '{{column(static_6.selection,[\"Valu\"]).asObject()}}';\nresult = foreach result generate coalesce(q_A.'{{column(static_6.selection,[\"Valu\"]).asObject()}}', q_B.'{{column(static_6.selection,[\"Valu\"]).asObject()}}') as '{{column(static_6.selection,[\"Valu\"]).asObject()}}',coalesce(sum(q_A.'TotValueUSD'),0) as 'A', coalesce(sum(q_B.'TotValueUSD'),0) as 'B';\nresult = foreach result generate '{{column(static_6.selection,[\"Valu\"]).asObject()}}',number_to_string( B-A,\"$#,###\") as 'Forecast Delta';\nendVal = foreach endVal generate \"Ending Value\" as '{{column(static_6.selection,[\"Valu\"]).asObject()}}',number_to_string(sum (endVal.'TotValueUSD'),\"$#,###\") as 'Forecast Delta';\nresult = order result by '{{column(static_6.selection,[\"Valu\"]).asObject()}}' asc;\nfinal = union startVal,result,endVal; replace the generate statement with number_to_string(sum (startVal.'TotValueUSD'),\"$#,###\") as 'Forecast Delta'
Here is how to set your y-values dynamically so it is not set to zero all the time. Having this functionality enables user to view data at a better angle since the variance will be more 'pronounced' by not having the minimum value start at zero all the time. Go into the dashboard, find the widget and set the JSON to the following.
."measureAxis1": { "sqrtScale": true, "showTitle": true, "showAxis": true, "title": "", "customDomain": { "low": "{{column(q_AxisDomain_1.result,[\"lowest\"]).asObject()}}", "showDomain": true "query": "q = load \"zds_IoTForecast5\";\nstartVal = filter q by {{column(qDateTest_1.selection,[\"cTimeStampText\"]).asEquality('cTimeStampText')}};\nendVal = filter q by {{column(q_SnapDate2_1.selection,[\"cTimeStampText\"]).asEquality('cTimeStampText')}};\nresult = group startVal by all full, endVal by all;\nresult = foreach result generate ( (sum(endVal.'TotValueUSD') + sum(startVal.'TotValueUSD'))/2) *.5 as 'Avg',(case when sum(endVal.'TotValueUSD') < sum(startVal.'TotValueUSD') then (sum(endVal.'TotValueUSD')) * .95 else (sum(startVal.'TotValueUSD'))*.95 end) as 'lowest';", |
Archives
June 2025
|

