Meliorainsights.com
Use of SAQL Index-Of() to pick out certain roles in a Flatten Transformation - by Dan Alindogan3/8/2022 Here’s an interesting use-case for a client of ours. They need reports that will be available to users who have a certain role ‘X” as well as having the same security for the role 2 levels up. This means that it has to bypass the next level up. Illustratively, given a role path of x / y / z / k / m, the data needs to be seen by roles x and z. In order to effect that, a flatten transformation with the self-Id checked is used, followed by a compute expression and the’ index_of’ string function. Listed below are the steps and settings as well as a link to the SAQL function “index_of” . To start off, the function “index_of” resolves to an integer marking the location of a specific character inside a string. https://developer.salesforce.com/docs/atlas.en-us.bi_dev_guide_saql.meta/bi_dev_guide_saql/bi_saql_functions_string_io.htm index_of(“connecticut” , “c”, 1,1) = 1 index_of (“connecticut”, “c”, 1, 3) = 9 index_of(“connecticut”, “c” 1,4) = 0 Why should someone integrate the function “index_of” into their SAQL? One reason is to isolate certain strings and use them when there is a flatten node dealing with Role Path. Here is an example of how we can use the “index_of” in a case where the role is in the security predicate. We want to show how we can filter out the appropriate role out of the string created by the flatten transformation. Role Path:
substring(‘Product’, , case index_of (“/”, 1, 2) = 10 then 10 , case index_of(“/”, 1,1) = 5 then 0 Else 0 ) then +1, 4) Resolves to:
Note: the 2nd case statement (, case index_of(“/”, 1,1) = 5 then 0 ) is superfluous but is there to show that anything other than the 2nd occurrence is “/” is ignored since we are interested in the self id and the 3rd role. After assigning the result of the ‘Resolves to’ list to a variable called ’ProperRole’, one can then insert it in the security predicate (ie… ‘ProperRole’ == $user.RoleID )
0 Comments
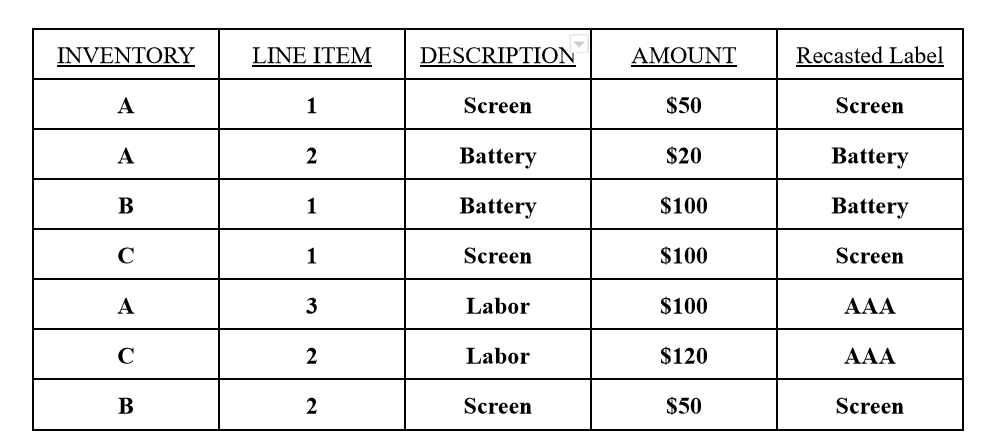
An interesting use-case came up with one of our supply chain clients. They needed to bin certain invoices into 1 of two categories--1) Full Service (any invoice that contains a 'Service Contract' line item OR 2) Retail (any invoice that does not have a service contract). This use-case utilizes 2 powerful TCRM nodes-- the compute relative and the compute expression.
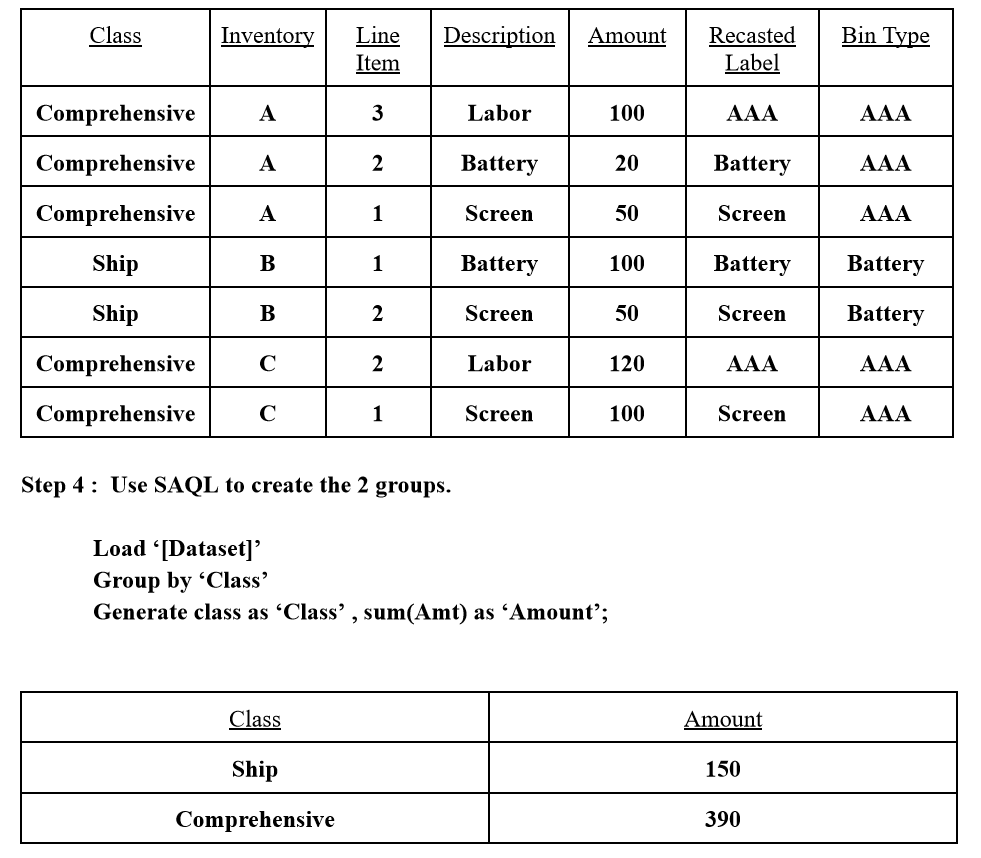
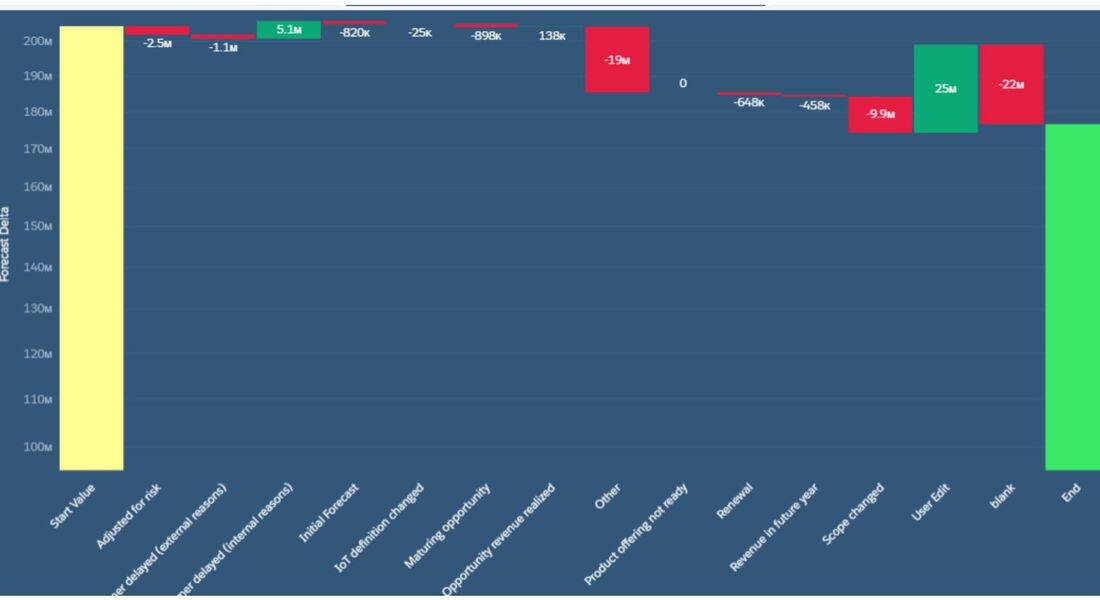
At a high level, the compute relative enables a comparison up and down the table (ie rows) while the compute expression goes left > right ie columns. Down below I will show a step by step guide to how one would tackle this use case. Step 1: Create a compute expression and label it as ‘Recasted Label’ (SAQL pseudocode follows) Load ‘[Dataset]’ Case when ‘Description’’ == “Labor” then “AAA” else “[Description]” Step 2: Use a Compute Relative Node to create a field called ‘Bin Type’ using the following settings in the Dialogue Box of that node Group by InventorySort by ‘Recasted Label’ Asc Create new field —> ‘Bin Type’ Aggregate f(x) = ‘first’ Step 3: Use a Compute Expression to create a new field “Class” using a CASE Statement. Case when ‘Bin Type’ != “AAA” Then “Ship” else “Comprehensive” so let's say you have a set of metrics that you want to create a time-series on. Maybe your team makes sales forecast on clients that changes over time. You can take a 'snapshot' of that forcast daily thru a scheduled dataflow and an append transformation node. At the end of a certain period your dataset may look like this...
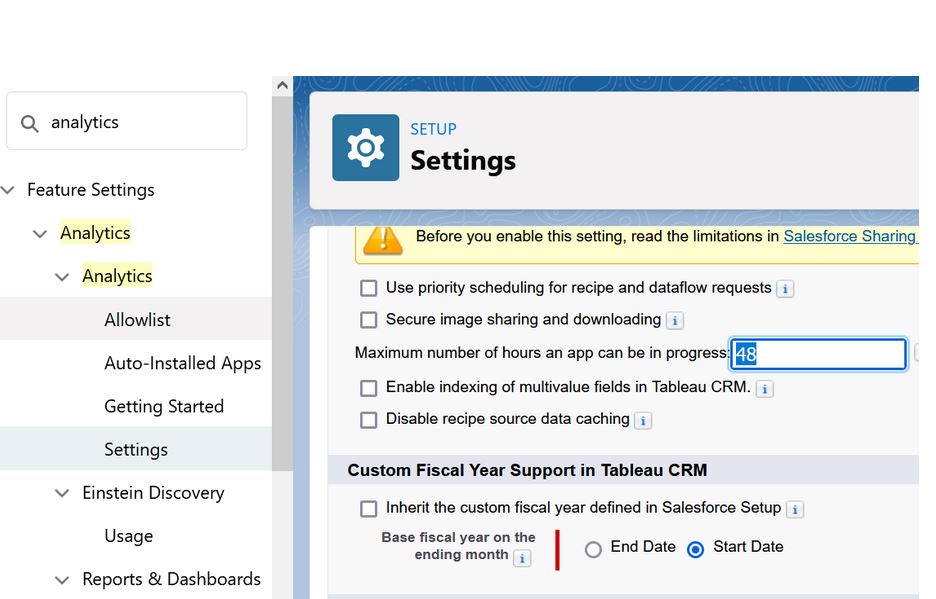
Client Date Forecast A January 3 $1000 B January 3 $5000 A March 2 $2000 B March 2 $3000 Code below creates a waterfall chart with a binding to control the grouping trigger. q = load \"zds_IoTForecast5\";\nstartVal = filter q by {{column(qDateTest_1.selection,[\"cTimeStampText\"]).asEquality('cTimeStampText')}};\nendVal = filter q by {{column(q_SnapDate2_1.selection,[\"cTimeStampText\"]).asEquality('cTimeStampText')}};\nq_A = filter q by {{column(qDateTest_1.selection,[\"cTimeStampText\"]).asEquality('cTimeStampText')}};\nq_B = filter q by {{column(q_SnapDate2_1.selection,[\"cTimeStampText\"]).asEquality('cTimeStampText')}};\nstartVal = group startVal by all;\nstartVal = foreach startVal generate \"Start Value\" as '{{column(static_6.selection,[\"Valu\"]).asObject()}}',number_to_string(sum (startVal.'TotValueUSD'),\"$#,###\") as 'Forecast Delta';\nendVal = group endVal by all;\nresult = group q_A by '{{column(static_6.selection,[\"Valu\"]).asObject()}}' full, q_B by '{{column(static_6.selection,[\"Valu\"]).asObject()}}';\nresult = foreach result generate coalesce(q_A.'{{column(static_6.selection,[\"Valu\"]).asObject()}}', q_B.'{{column(static_6.selection,[\"Valu\"]).asObject()}}') as '{{column(static_6.selection,[\"Valu\"]).asObject()}}',coalesce(sum(q_A.'TotValueUSD'),0) as 'A', coalesce(sum(q_B.'TotValueUSD'),0) as 'B';\nresult = foreach result generate '{{column(static_6.selection,[\"Valu\"]).asObject()}}',number_to_string( B-A,\"$#,###\") as 'Forecast Delta';\nendVal = foreach endVal generate \"Ending Value\" as '{{column(static_6.selection,[\"Valu\"]).asObject()}}',number_to_string(sum (endVal.'TotValueUSD'),\"$#,###\") as 'Forecast Delta';\nresult = order result by '{{column(static_6.selection,[\"Valu\"]).asObject()}}' asc;\nfinal = union startVal,result,endVal; This setting is enabled in the Salesforce CRM side by your system administrator. Setting this enables accurate fiscal year groupings / filters in TCRM.
After creating the dataset that contains a flatten transformation, you need to modify the dataset XMD and turn 'isSystemField' to 'false' . This will enable user to see the field in a lens to debug.
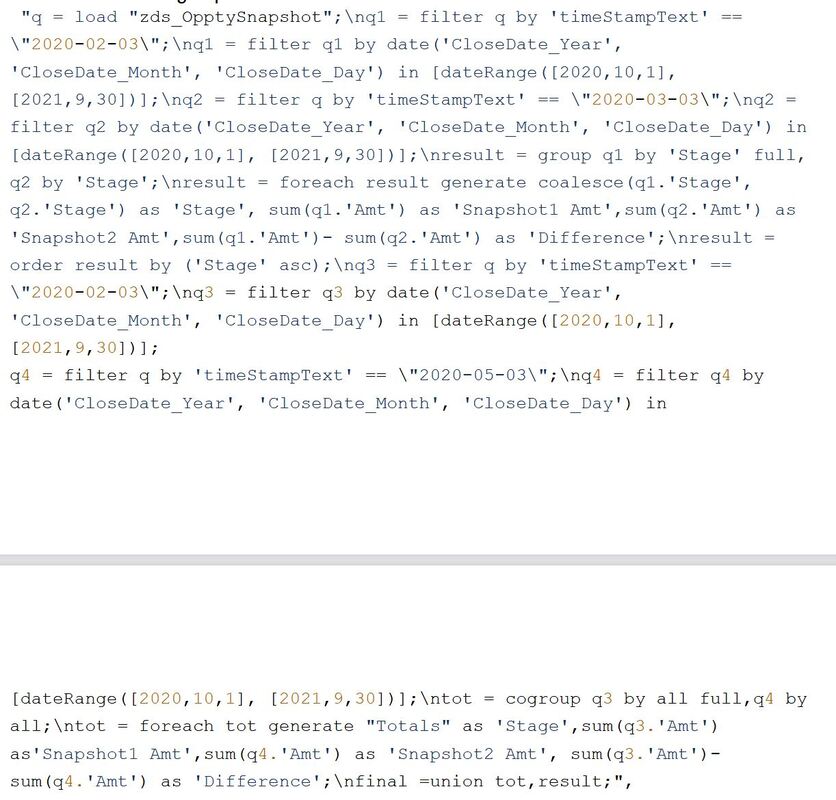
CODE BELOW { "flattnMgr": { "schema": { "objects": [ { "label": "ManagerPathText", "fields": [ { "name": "mgrPath", "label": "mgrPath", "isSystemField": false }, { "name": "ManagersList", "label": "ManagersList", "isSystemField": false } ] } ] }, "action": "flatten", "parameters": { "include_self_id": false, "self_field": "Id", "multi_field": "ManagersList", "parent_field": "ManagerId", "path_field": "mgrPath", "source": "LoadUser" } } q = load \"zds_OpptySnapshot\";\nq1 = filter q by {{column(timeStampText_4.selection,[\"Snapshot1\"]).asEquality('timeStampText')}};\n
q1 = filter q1 by date('CloseDate_Year', 'CloseDate_Month', 'CloseDate_Day') in {{cell(static_2.selection,0,\"Valu\").asString()}};\n q2 = filter q by {{column(timeStampText_5.selection,[\"Snapshot2\"]).asEquality('timeStampText')}};\n q2 = filter q2 by date('CloseDate_Year', 'CloseDate_Month', 'CloseDate_Day') in {{cell(q_FY2_1.selection,0,\"Valu\").asString()}};\n result = group q1 by 'Stage' full, q2 by 'Stage';\nr esult = foreach result generate coalesce(q1.'Stage', q2.'Stage') as 'Stage', number_to_string(sum(q1.'Amt'), \"$#,####\") as 'Snapshot1 Amt', number_to_string(sum(q2.'Amt'), \"$#,####\") as 'Snapshot2 Amt', number_to_string((sum(q1.'Amt')- sum(q2.'Amt')), \"$#,####\") as 'Difference';\nresult = order result by ('Stage' asc);\nq3 = filter q by {{column(timeStampText_4.selection,[\"Snapshot1\"]).asEquality('timeStampText')}};\nq 3 = filter q3 by date('CloseDate_Year', 'CloseDate_Month', 'CloseDate_Day') in {{cell(static_2.selection,0,\"Valu\").asString()}};\n q4 = filter q by {{column(timeStampText_5.selection,[\"Snapshot2\"]).asEquality('timeStampText')}};\n q4 = filter q4 by date('CloseDate_Year', 'CloseDate_Month', 'CloseDate_Day') in {{cell(q_FY2_1.selection,0,\"Valu\").asString()}};\n tot = cogroup q3 by all full,q4 by all;\n tot = foreach tot generate \"Totals\" as 'Stage', number_to_string(sum(q3.'Amt'), \"$#,####\") as'Snapshot1 Amt', number_to_string(sum(q4.'Amt'), \"$#,####\") as 'Snapshot2 Amt', number_to_string((sum(q3.'Amt')- sum(q4.'Amt')), \"$#,####\") as 'Difference';\ nfinal =union tot,result;\n", "receiveFacetSource": { "mode": "all", The flatten transformation is a powerful node for flattening heirarchy. A typical use-case is for enforcing 'who sees what' up the reporting chain through the use of security predicates. Code below details the steps in tweakign the JSON of the dataflow to be able to see the heirarchy in string form. This is used for debugging purposes. As an example, if you have a flatten node to see the id and the managers id and the manager of the manager,etc, you need to add the schema section in the JSON in order for you to see the manager path in the UI part of the lens in TCRM.
{ "flattnMgr": { "schema": { "objects": [ { "label": "ManagerPathText", "fields": [ { "name": "mgrPath", "label": "mgrPath", "isSystemField": false }, { "name": "ManagersList", "label": "ManagersList", "isSystemField": false } ] } ] }, "action": "flatten", "parameters": { "include_self_id": false, "self_field": "Id", "multi_field": "ManagersList", "parent_field": "ManagerId", "path_field": "mgrPath", "source": "LoadUser" } } q = load \"zds_OpptySnapshot\";\nq1 = filter q by {{column(timeStampText_4.selection,[\"Snapshot1\"]).asEquality('timeStampText')}};\nq1 = filter q1 by date('CloseDate_Year', 'CloseDate_Month', 'CloseDate_Day') in {{cell(static_2.selection,0,\"Valu\").asString()}};\nq2 = filter q by {{column(timeStampText_5.selection,[\"Snapshot2\"]).asEquality('timeStampText')}};\nq2 = filter q2 by date('CloseDate_Year', 'CloseDate_Month', 'CloseDate_Day') in {{cell(q_FY2_1.selection,0,\"Valu\").asString()}};\nresult = group q1 by 'Stage' full, q2 by 'Stage';\nresult = foreach result generate coalesce(q1.'Stage', q2.'Stage') as 'Stage', number_to_string(sum(q1.'Amt'), \"$#,####\") as 'Snapshot1 Amt',number_to_string(sum(q2.'Amt'), \"$#,####\") as 'Snapshot2 Amt', number_to_string((sum(q1.'Amt')- sum(q2.'Amt')), \"$#,####\") as 'Difference';\nresult = order result by ('Stage' asc);\nq3 = filter q by {{column(timeStampText_4.selection,[\"Snapshot1\"]).asEquality('timeStampText')}};\nq3 = filter q3 by date('CloseDate_Year', 'CloseDate_Month', 'CloseDate_Day') in {{cell(static_2.selection,0,\"Valu\").asString()}};\nq4 = filter q by {{column(timeStampText_5.selection,[\"Snapshot2\"]).asEquality('timeStampText')}};\nq4 = filter q4 by date('CloseDate_Year', 'CloseDate_Month', 'CloseDate_Day') in {{cell(q_FY2_1.selection,0,\"Valu\").asString()}};\ntot = cogroup q3 by all full,q4 by all;\ntot = foreach tot generate \"Totals\" as 'Stage', number_to_string(sum(q3.'Amt'), \"$#,####\") as'Snapshot1 Amt', number_to_string(sum(q4.'Amt'), \"$#,####\") as 'Snapshot2 Amt', number_to_string((sum(q3.'Amt')- sum(q4.'Amt')), \"$#,####\") as 'Difference';\nfinal =union tot,result;\n",
"receiveFacetSource": { |
|
Site powered by Weebly. Managed by Hostwinds

