A blog series distilling quantitative concepts /use-cases in CRM Analytics (Einstein Analytics)
|
case when 'Dept_Chair_Acct__c' =="true" then "https://xxxxxxx/file-asset/checkboxtickpng1" else "https://xxxxxxxx/file-asset/checkboxuntickpng1"
end Q_runrates_1
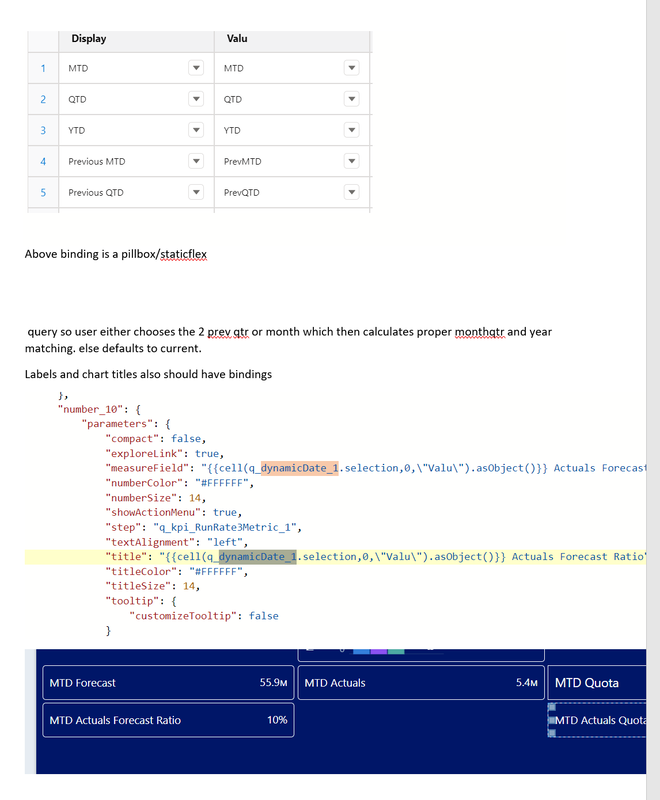
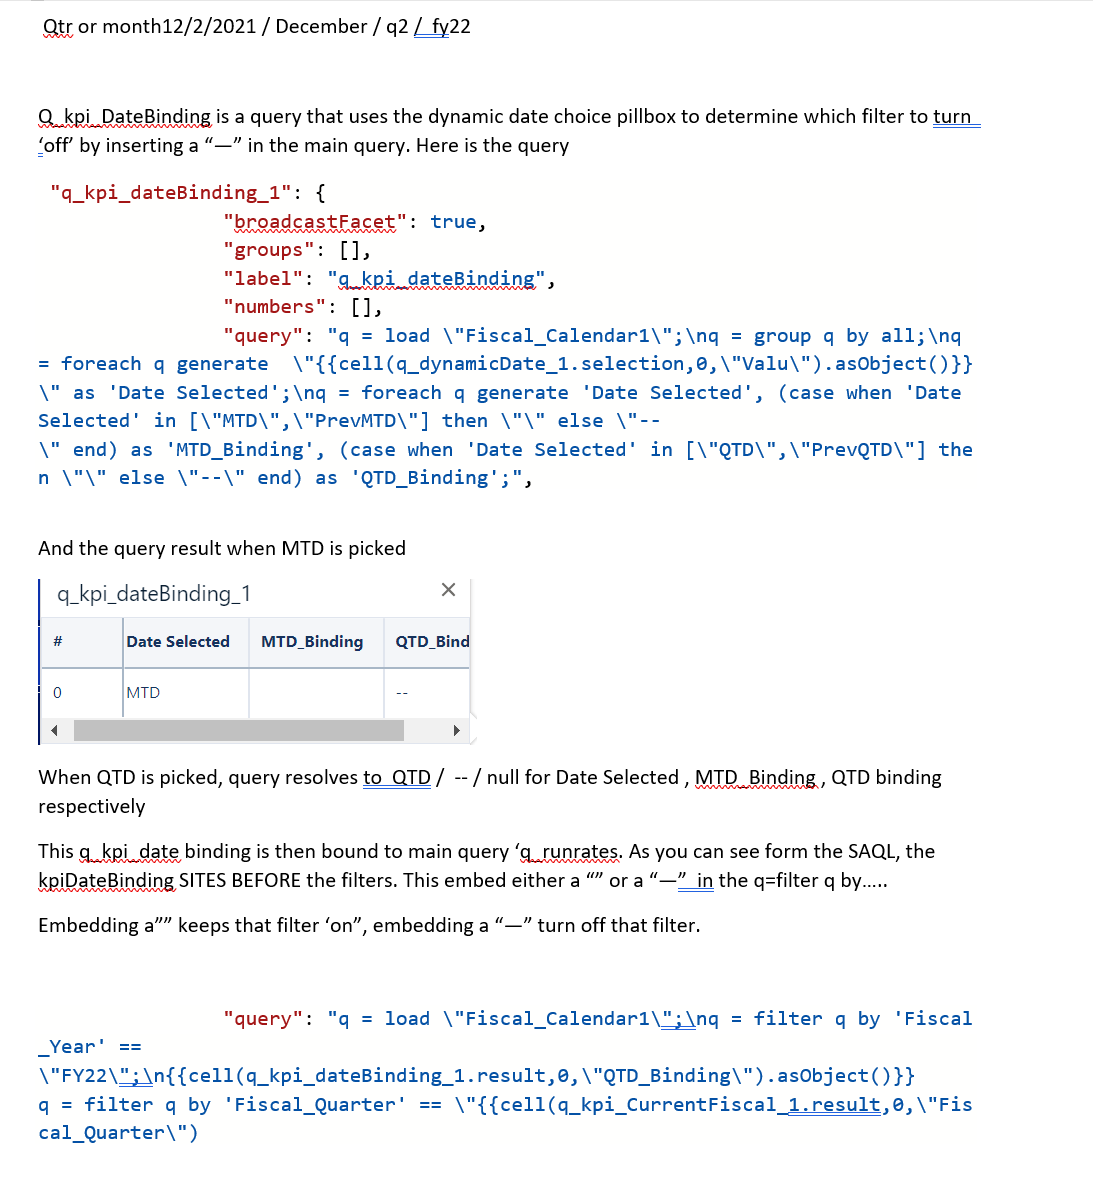
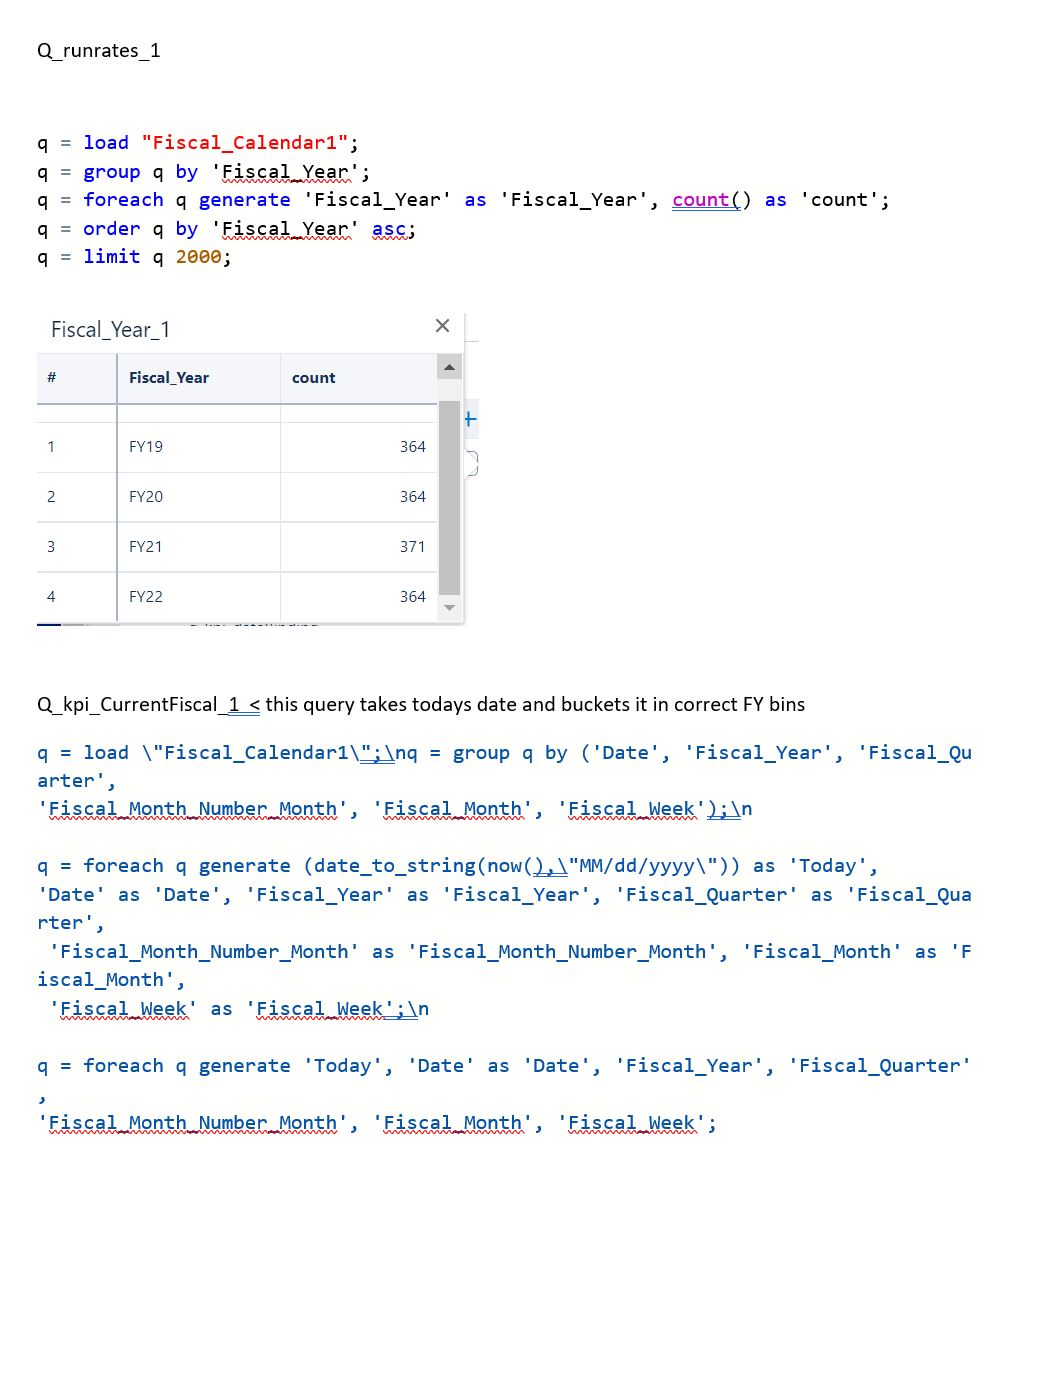
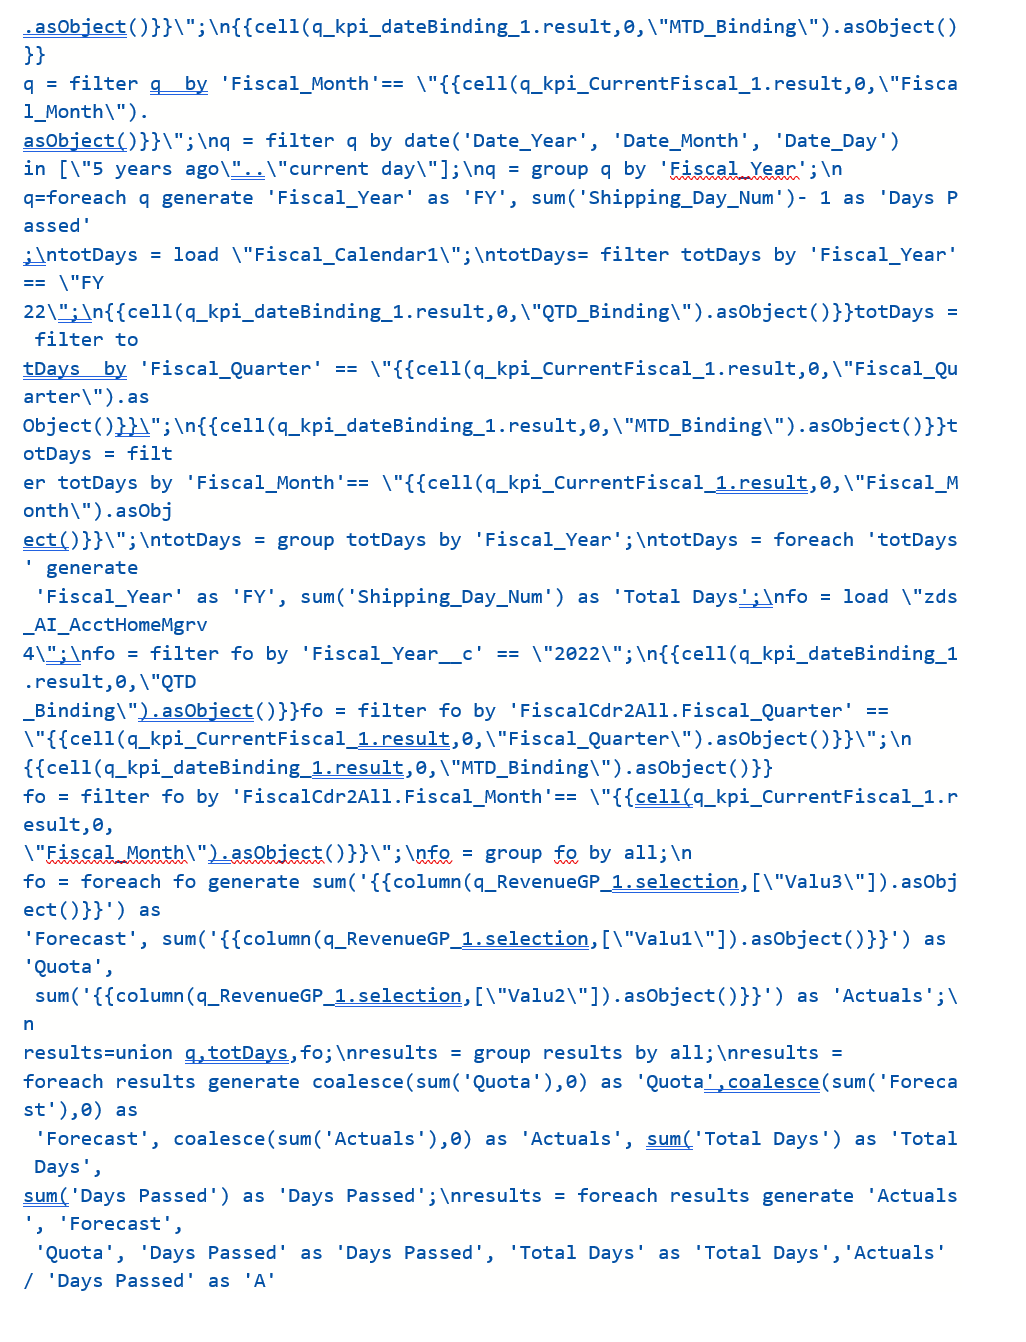
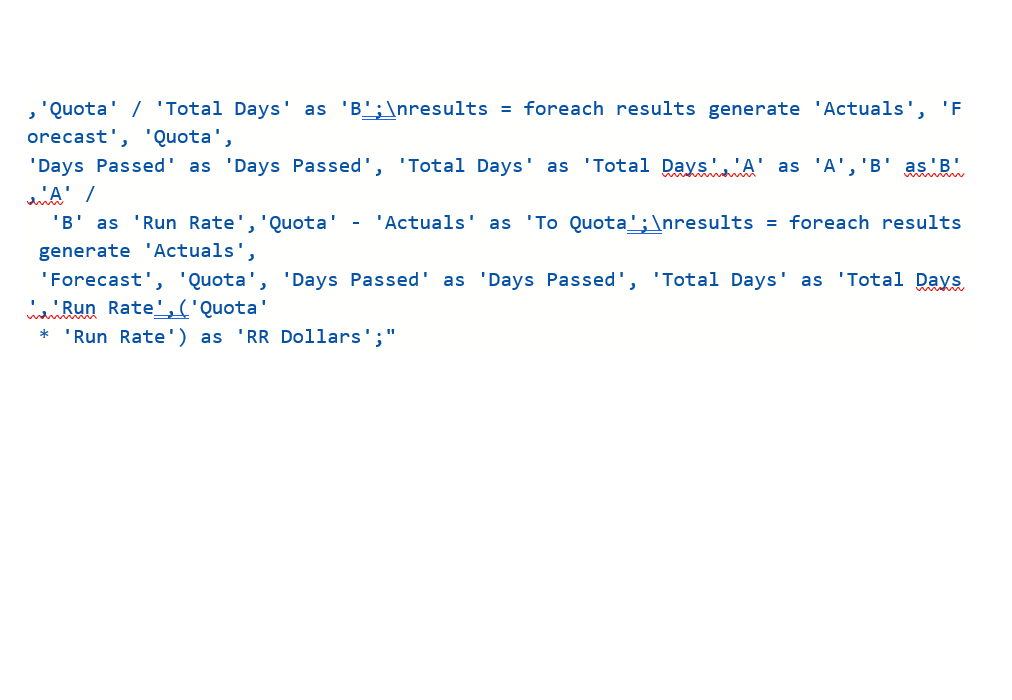
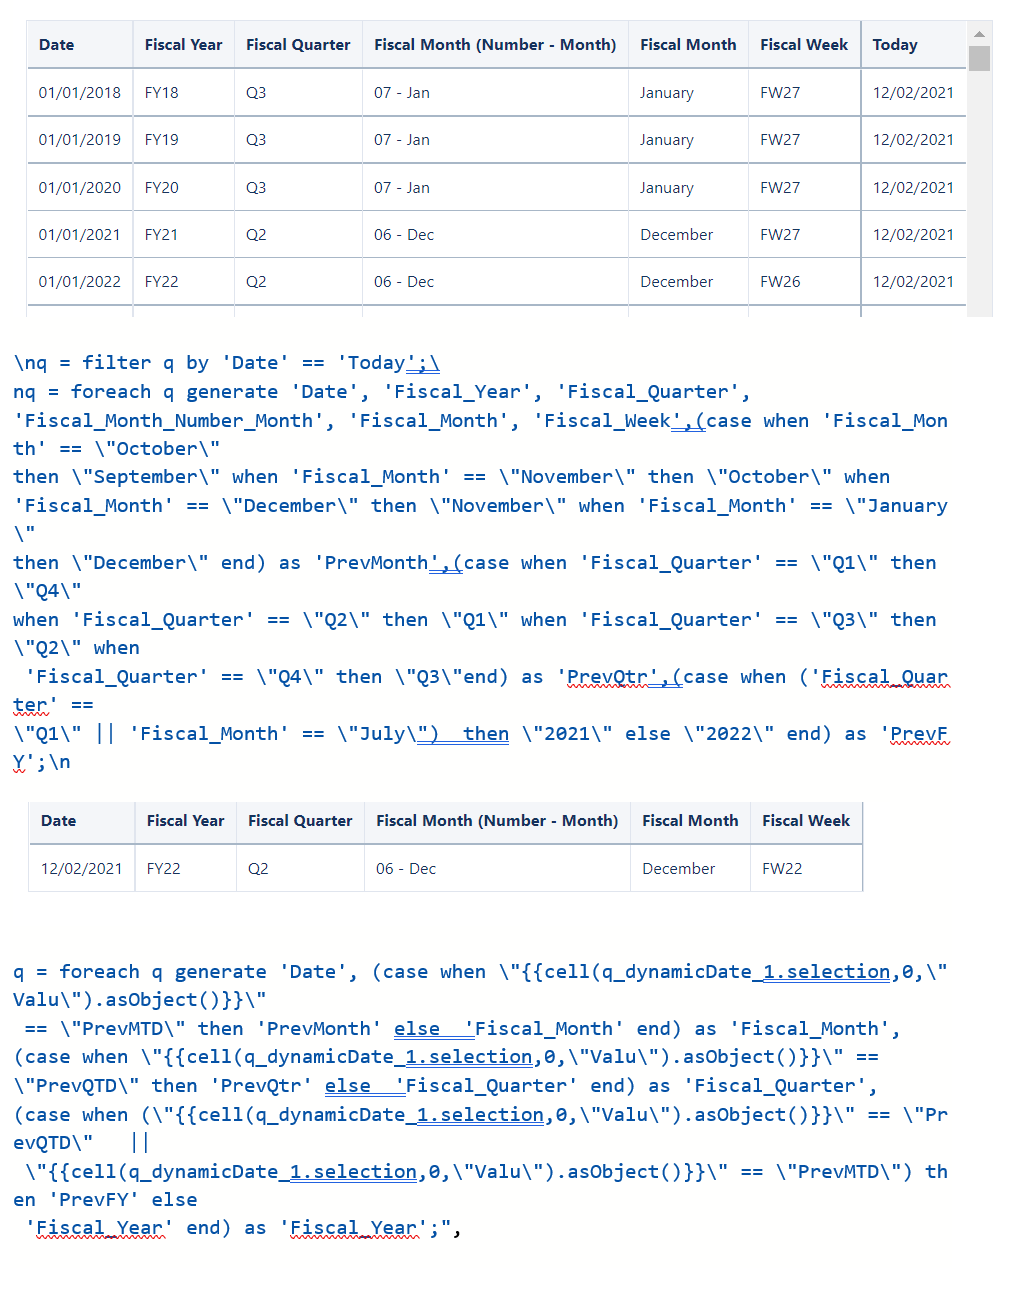
q = load "Fiscal_Calendar1"; q = group q by 'Fiscal_Year'; q = foreach q generate 'Fiscal_Year' as 'Fiscal_Year', count() as 'count'; q = order q by 'Fiscal_Year' asc; q = limit q 2000; Q_kpi_CurrentFiscal_1 < this query takes todays date and buckets it in correct FY bins q = load \"Fiscal_Calendar1\";\nq = group q by ('Date', 'Fiscal_Year', 'Fiscal_Quarter', 'Fiscal_Month_Number_Month', 'Fiscal_Month', 'Fiscal_Week');\n q = foreach q generate (date_to_string(now(),\"MM/dd/yyyy\")) as 'Today', 'Date' as 'Date', 'Fiscal_Year' as 'Fiscal_Year', 'Fiscal_Quarter' as 'Fiscal_Quarter', 'Fiscal_Month_Number_Month' as 'Fiscal_Month_Number_Month', 'Fiscal_Month' as 'Fiscal_Month', 'Fiscal_Week' as 'Fiscal_Week';\n q = foreach q generate 'Today', 'Date' as 'Date', 'Fiscal_Year', 'Fiscal_Quarter', 'Fiscal_Month_Number_Month', 'Fiscal_Month', 'Fiscal_Week'; \nq = filter q by 'Date' == 'Today';\ nq = foreach q generate 'Date', 'Fiscal_Year', 'Fiscal_Quarter', 'Fiscal_Month_Number_Month', 'Fiscal_Month', 'Fiscal_Week',(case when 'Fiscal_Month' == \"October\" then \"September\" when 'Fiscal_Month' == \"November\" then \"October\" when 'Fiscal_Month' == \"December\" then \"November\" when 'Fiscal_Month' == \"January\" then \"December\" end) as 'PrevMonth',(case when 'Fiscal_Quarter' == \"Q1\" then \"Q4\" when 'Fiscal_Quarter' == \"Q2\" then \"Q1\" when 'Fiscal_Quarter' == \"Q3\" then \"Q2\" when 'Fiscal_Quarter' == \"Q4\" then \"Q3\"end) as 'PrevQtr',(case when ('Fiscal_Quarter' == \"Q1\" || 'Fiscal_Month' == \"July\") then \"2021\" else \"2022\" end) as 'PrevFY';\n q = foreach q generate 'Date', (case when \"{{cell(q_dynamicDate_1.selection,0,\"Valu\").asObject()}}\" == \"PrevMTD\" then 'PrevMonth' else 'Fiscal_Month' end) as 'Fiscal_Month', (case when \"{{cell(q_dynamicDate_1.selection,0,\"Valu\").asObject()}}\" == \"PrevQTD\" then 'PrevQtr' else 'Fiscal_Quarter' end) as 'Fiscal_Quarter', (case when (\"{{cell(q_dynamicDate_1.selection,0,\"Valu\").asObject()}}\" == \"PrevQTD\" || \"{{cell(q_dynamicDate_1.selection,0,\"Valu\").asObject()}}\" == \"PrevMTD\") then 'PrevFY' else 'Fiscal_Year' end) as 'Fiscal_Year';", Above binding is a pillbox/staticflex query so user either chooses the 2 prev qtr or month which then calculates proper monthqtr and year matching. else defaults to current. Labels and chart titles also should have bindings Qtr or month12/2/2021 / December / q2 / fy22 Q_kpi_DateBinding is a query that uses the dynamic date choice pillbox to determine which filter to turn ‘off’ by inserting a “—” in the main query. Here is the query "q_kpi_dateBinding_1": { "broadcastFacet": true, "groups": [], "label": "q_kpi_dateBinding", "numbers": [], "query": "q = load \"Fiscal_Calendar1\";\nq = group q by all;\nq = foreach q generate \"{{cell(q_dynamicDate_1.selection,0,\"Valu\").asObject()}}\" as 'Date Selected';\nq = foreach q generate 'Date Selected', (case when 'Date Selected' in [\"MTD\",\"PrevMTD\"] then \"\" else \"--\" end) as 'MTD_Binding', (case when 'Date Selected' in [\"QTD\",\"PrevQTD\"] then \"\" else \"--\" end) as 'QTD_Binding';", And the query result when MTD is picked When QTD is picked, query resolves to QTD / -- / null for Date Selected , MTD_Binding , QTD binding respectively This q_kpi_date binding is then bound to main query ‘q_runrates. As you can see form the SAQL, the kpiDateBinding SITES BEFORE the filters. This embed either a “” or a “—” in the q=filter q by….. Embedding a”” keeps that filter ‘on”, embedding a “—” turn off that filter. "query": "q = load \"Fiscal_Calendar1\";\nq = filter q by 'Fiscal_Year' == \"FY22\";\n{{cell(q_kpi_dateBinding_1.result,0,\"QTD_Binding\").asObject()}} q = filter q by 'Fiscal_Quarter' == \"{{cell(q_kpi_CurrentFiscal_1.result,0,\"Fiscal_Quarter\") .asObject()}}\";\n{{cell(q_kpi_dateBinding_1.result,0,\"MTD_Binding\").asObject()}} q = filter q by 'Fiscal_Month'== \"{{cell(q_kpi_CurrentFiscal_1.result,0,\"Fiscal_Month\"). asObject()}}\";\nq = filter q by date('Date_Year', 'Date_Month', 'Date_Day') in [\"5 years ago\"..\"current day\"];\nq = group q by 'Fiscal_Year';\n q=foreach q generate 'Fiscal_Year' as 'FY', sum('Shipping_Day_Num')- 1 as 'Days Passed' ;\ntotDays = load \"Fiscal_Calendar1\";\ntotDays= filter totDays by 'Fiscal_Year'== \"FY 22\";\n{{cell(q_kpi_dateBinding_1.result,0,\"QTD_Binding\").asObject()}}totDays = filter to tDays by 'Fiscal_Quarter' == \"{{cell(q_kpi_CurrentFiscal_1.result,0,\"Fiscal_Quarter\").as Object()}}\";\n{{cell(q_kpi_dateBinding_1.result,0,\"MTD_Binding\").asObject()}}totDays = filt er totDays by 'Fiscal_Month'== \"{{cell(q_kpi_CurrentFiscal_1.result,0,\"Fiscal_Month\").asObj ect()}}\";\ntotDays = group totDays by 'Fiscal_Year';\ntotDays = foreach 'totDays' generate 'Fiscal_Year' as 'FY', sum('Shipping_Day_Num') as 'Total Days';\nfo = load \"zds_AI_AcctHomeMgrv 4\";\nfo = filter fo by 'Fiscal_Year__c' == \"2022\";\n{{cell(q_kpi_dateBinding_1.result,0,\"QTD _Binding\").asObject()}}fo = filter fo by 'FiscalCdr2All.Fiscal_Quarter' == \"{{cell(q_kpi_CurrentFiscal_1.result,0,\"Fiscal_Quarter\").asObject()}}\";\n {{cell(q_kpi_dateBinding_1.result,0,\"MTD_Binding\").asObject()}} fo = filter fo by 'FiscalCdr2All.Fiscal_Month'== \"{{cell(q_kpi_CurrentFiscal_1.result,0, \"Fiscal_Month\").asObject()}}\";\nfo = group fo by all;\n fo = foreach fo generate sum('{{column(q_RevenueGP_1.selection,[\"Valu3\"]).asObject()}}') as 'Forecast', sum('{{column(q_RevenueGP_1.selection,[\"Valu1\"]).asObject()}}') as 'Quota', sum('{{column(q_RevenueGP_1.selection,[\"Valu2\"]).asObject()}}') as 'Actuals';\n results=union q,totDays,fo;\nresults = group results by all;\nresults = foreach results generate coalesce(sum('Quota'),0) as 'Quota',coalesce(sum('Forecast'),0) as 'Forecast', coalesce(sum('Actuals'),0) as 'Actuals', sum('Total Days') as 'Total Days', sum('Days Passed') as 'Days Passed';\nresults = foreach results generate 'Actuals', 'Forecast', 'Quota', 'Days Passed' as 'Days Passed', 'Total Days' as 'Total Days','Actuals' / 'Days Passed' as 'A' ,'Quota' / 'Total Days' as 'B';\nresults = foreach results generate 'Actuals', 'Forecast', 'Quota', 'Days Passed' as 'Days Passed', 'Total Days' as 'Total Days','A' as 'A','B' as'B','A' / 'B' as 'Run Rate','Quota' - 'Actuals' as 'To Quota';\nresults = foreach results generate 'Actuals', 'Forecast', 'Quota', 'Days Passed' as 'Days Passed', 'Total Days' as 'Total Days','Run Rate',('Quota' * 'Run Rate') as 'RR Dollars';" {
"label": "zdb_POC", "mobileDisabled": false, "state": { "dataSourceLinks": [], "filters": [], "gridLayouts": [ { "name": "Default", "numColumns": 12, "pages": [ { "label": "Untitled", "name": "f8c85d0c-83b5-45c7-867c-7eb5a9c73d4d", "navigationHidden": false, "widgets": [ { "colspan": 3, "column": 5, "name": "chart_2", "row": 4, "rowspan": 3, "widgetStyle": {} }, { "colspan": 5, "column": 2, "name": "pillbox_2", "row": 9, "rowspan": 1, "widgetStyle": {} } ] } ], "rowHeight": "normal", "selectors": [], "style": { "alignmentX": "left", "alignmentY": "top", "backgroundColor": "#F2F6FA", "cellSpacingX": 8, "cellSpacingY": 8, "fit": "original", "gutterColor": "#C5D3E0" }, "version": 1 } ], "layouts": [], "steps": { "static_2": { "broadcastFacet": true, "columns": { "Valu": { "type": "string" }, "Display": { "type": "string" } }, "label": "", "selectMode": "singlerequired", "type": "staticflex", "values": [ { "Display": "Dallas", "valu": "[\"Dallas\"]" }, { "Display": "Boston", "valu": "[\"Boston\"]" }, { "Display": "Most", "valu": "[\"Dallas\",\"Boston\"]" } ], "numbers": [], "strings": [], "groups": [] }, "test2_1": { "broadcastFacet": true, "groups": [], "label": "test2", "numbers": [], "query": "q = load \"zds_jobs\";\nq = group q by 'Branch__c.Name';\nq = foreach q generate 'Branch__c.Name' as 'Branch__c.Name', count() as 'count';\nq = order q by 'Branch__c.Name' asc;\n", "receiveFacetSource": { "mode": "all", "steps": [] }, "selectMode": "single", "strings": [], "type": "saql", "useGlobal": true, "visualizationParameters": { "parameters": { "autoFitMode": "keepLabels", "showValues": true, "bins": { "breakpoints": { "high": 100, "low": 0 }, "bands": { "high": { "color": "#008000", "label": "" }, "low": { "color": "#B22222", "label": "" }, "medium": { "color": "#ffa500", "label": "" } } }, "legend": { "descOrder": false, "showHeader": true, "show": true, "customSize": "auto", "position": "right-top", "inside": false }, "axisMode": "multi", "tooltip": { "content": { "legend": { "showBinLabel": true, "measures": [], "showNullValues": true, "customizeLegend": false, "showPercentage": true, "showDimensions": true, "showMeasures": true, "dimensions": [] } } }, "visualizationType": "hbar", "title": { "fontSize": 14, "subtitleFontSize": 11, "label": "", "align": "center", "subtitleLabel": "" }, "binValues": false, "trellis": { "flipLabels": false, "showGridLines": true, "size": [ 100, 100 ], "enable": false, "type": "x", "chartsPerLine": 4 }, "showActionMenu": true, "measureAxis2": { "sqrtScale": false, "showTitle": true, "showAxis": true, "title": "", "customDomain": { "showDomain": false } }, "measureAxis1": { "sqrtScale": false, "showTitle": true, "showAxis": true, "title": "", "customDomain": { "showDomain": false } }, "theme": "wave", "dimensionAxis": { "showTitle": true, "customSize": "auto", "showAxis": true, "title": "", "icons": { "useIcons": false, "iconProps": { "fit": "cover", "column": "", "type": "round" } } }, "applyConditionalFormatting": true }, "type": "chart" } }, "test3_1": { "broadcastFacet": true, "groups": [], "label": "test3", "numbers": [], "query": "q = load \"zds_jobs\";\nq = filter q by 'Branch__c.Name' in {{column(static_2.selection,[\"valu\"]).asObject()}};\nq = group q by 'Branch__c';\nq = foreach q generate 'Branch__c' as 'Branch__c', count() as 'count';\nq = order q by 'Branch__c' asc;\n", "receiveFacetSource": { "mode": "all", "steps": [] }, "selectMode": "single", "strings": [], "type": "saql", "useGlobal": true, "visualizationParameters": { "parameters": { "autoFitMode": "keepLabels", "showValues": true, "bins": { "breakpoints": { "high": 100, "low": 0 }, "bands": { "high": { "color": "#008000", "label": "" }, "low": { "color": "#B22222", "label": "" }, "medium": { "color": "#ffa500", "label": "" } } }, "legend": { "descOrder": false, "showHeader": true, "show": true, "customSize": "auto", "position": "right-top", "inside": false }, "axisMode": "multi", "tooltip": { "content": { "legend": { "showBinLabel": true, "measures": [], "showNullValues": true, "customizeLegend": false, "showPercentage": true, "showDimensions": true, "showMeasures": true, "dimensions": [] } } }, "visualizationType": "hbar", "title": { "fontSize": 14, "subtitleFontSize": 11, "label": "", "align": "center", "subtitleLabel": "" }, "binValues": false, "trellis": { "flipLabels": false, "showGridLines": true, "size": [ 100, 100 ], "enable": false, "type": "x", "chartsPerLine": 4 }, "showActionMenu": true, "measureAxis2": { "sqrtScale": false, "showTitle": true, "showAxis": true, "title": "", "customDomain": { "showDomain": false } }, "measureAxis1": { "sqrtScale": false, "showTitle": true, "showAxis": true, "title": "", "customDomain": { "showDomain": false } }, "theme": "wave", "dimensionAxis": { "showTitle": true, "customSize": "auto", "showAxis": true, "title": "", "icons": { "useIcons": false, "iconProps": { "fit": "cover", "column": "", "type": "round" } } }, "applyConditionalFormatting": true }, "type": "chart" } } }, "widgetStyle": { "backgroundColor": "#FFFFFF", "borderColor": "#E6ECF2", "borderEdges": [], "borderRadius": 0, "borderWidth": 1 }, "widgets": { "pillbox_2": { "parameters": { "compact": false, "exploreLink": false, "fontSize": 14, "selectedTab": { "backgroundColor": "#0070D2", "borderColor": "#C6D3E1", "borderEdges": [ "all" ], "borderWidth": 1, "textColor": "#FFFFFF" }, "showActionMenu": true, "step": "static_2", "textColor": "#0070D2" }, "type": "pillbox" }, "chart_2": { "parameters": { "autoFitMode": "keepLabels", "showValues": true, "bins": { "breakpoints": { "high": 100, "low": 0 }, "bands": { "high": { "color": "#008000", "label": "" }, "low": { "color": "#B22222", "label": "" }, "medium": { "color": "#ffa500", "label": "" } } }, "legend": { "descOrder": false, "showHeader": true, "show": true, "customSize": "auto", "position": "right-top", "inside": false }, "axisMode": "multi", "tooltip": { "content": { "legend": { "showBinLabel": true, "measures": [], "showNullValues": true, "customizeLegend": false, "showPercentage": true, "showDimensions": true, "showMeasures": true, "dimensions": [] } } }, "visualizationType": "hbar", "exploreLink": true, "title": { "fontSize": 14, "subtitleFontSize": 11, "label": "", "align": "center", "subtitleLabel": "" }, "binValues": false, "trellis": { "flipLabels": false, "showGridLines": true, "size": [ 100, 100 ], "enable": false, "type": "x", "chartsPerLine": 4 }, "showActionMenu": true, "measureAxis2": { "sqrtScale": false, "showTitle": true, "showAxis": true, "title": "", "customDomain": { "showDomain": false } }, "measureAxis1": { "sqrtScale": false, "showTitle": true, "showAxis": true, "title": "", "customDomain": { "showDomain": false } }, "theme": "wave", "step": "test3_1", "dimensionAxis": { "showTitle": true, "customSize": "auto", "showAxis": true, "title": "", "icons": { "useIcons": false, "iconProps": { "fit": "cover", "column": "", "type": "round" } } }, "applyConditionalFormatting": true }, "type": "chart" } } }, "datasets": [ { "id": "0Fb8W0000005sNQSAY", "label": "zds_jobs", "name": "zds_jobs", "url": "/services/data/v54.0/wave/datasets/0Fb8W0000005sNQSAY" } ] } |