A blog series distilling quantitative concepts /use-cases in CRM Analytics (Einstein Analytics)
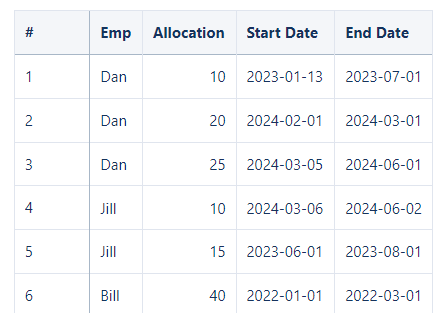 Got a use-case from a cohort looking for help in creating a heat map that shows an employees allocation in hours for a project. In the mockup csv file I created for this POC, we can see that Dan is engaged in a project from Jan 2023 to July 2023 for 10 hours.... engaged in Feb 2024 to March 2024 for 20 hours and so on.....The challenge is that the data only provides the start date and end date which is not a problem for a 2 month engagement. However, Dan's hours need to be on the heatmap for the missing months! In above example he needs a plot for Feb 2023, Mar 2023, april 2023 ...up to July 2023. How? By using the fill() function and some string and data manipulation. The big secret is creating a string called 'concat' that embeds the needed info that will be propagated in the newly generated months by the fill() function. One concaenates thie start,enddates and allocation and name... then 'decodes' it in the next geneate by statements, calcualtes the epoch seconds,etc. A case statement then goes row-by-row to mark the 'busy?' row as true or false if the row is inside the project span. Code: q = load "DanCSV"; --code the concat string to contain important info q = foreach q generate q.'Emp' as 'emp',q.'Allocation',q.'Start_Date_Month',q.'Start_Date_Year',q.'Start_Date_Day',q.'End_Date','Start_Date'+'End_Date'+"!"+'Emp'+"!"+number_to_string('Allocation',"0") as 'concat'; --use the fill function to generate the missing dates q= fill q by (dateCols=('Start_Date_Year','Start_Date_Month','Start_Date_Day',"Y-M-D"), startDate="2023-01-01", endDate="2024-12-31",partition='concat'); --start to decode the concat by getting the Nameindex and allocIndex indices for later use q = foreach q generate 'concat','emp','Start_Date_Year'+"-"+'Start_Date_Month'+"-"+'Start_Date_Day' as 'TopDay',substr('concat',1,10)as 'ProjStart',substr('concat',11,10)as 'ProjEnd',index_of('concat',"!",1,1) as 'NameIndx',index_of('concat',"!",1,2) as 'AllocIndx'; --this 'unpacks'the concat string back into original components. q = foreach q generate 'concat','emp', 'TopDay', 'ProjStart', 'ProjEnd', 'NameIndx', 'AllocIndx','AllocIndx'-'NameIndx'-1 as 'NameLength'; --retrieve the indexes q = foreach q generate 'concat','emp', 'TopDay', 'ProjStart', 'ProjEnd', 'NameIndx', 'AllocIndx','NameLength',substr('concat','NameIndx'+1,'NameLength') as 'NewEmp',substr('concat','AllocIndx'+1) as 'NewAlloc'; ---surface the epoch secords for all the dates q = foreach q generate 'NewEmp', 'TopDay', 'ProjStart', 'ProjEnd', 'NewAlloc',date_to_epoch(toDate('TopDay',"yyyy-MM-dd")) as 'TopDaySec',date_to_epoch(toDate('ProjStart',"yyyy-MM-dd")) as 'ProjStartSec',date_to_epoch(toDate('ProjEnd',"yyyy-MM-dd")) as 'ProjEndSec',month_first_day(toDate('TopDay',"yyyy-MM-dd")) as 'monthFD'; --compare topday to start end dates and flag rows that are within span q = foreach q generate 'NewEmp', 'TopDay', 'ProjStart', 'ProjEnd', 'NewAlloc', 'TopDaySec','ProjStartSec','ProjEndSec', 'monthFD',case when ('TopDaySec'>= 'ProjStartSec' and 'TopDaySec'<= 'ProjEndSec') then "true" else "false" end as 'busy'; --show only busy rows. q2=filter q by 'busy'=="true"; q2 = foreach q2 generate 'NewEmp', 'TopDay', 'ProjStart', 'ProjEnd', 'NewAlloc', 'monthFD','busy'; q2=group q2 by ('NewEmp','monthFD'); q2 = foreach q2 generate 'NewEmp','monthFD' ,string_to_number(min('NewAlloc') ) as 'alloc'; 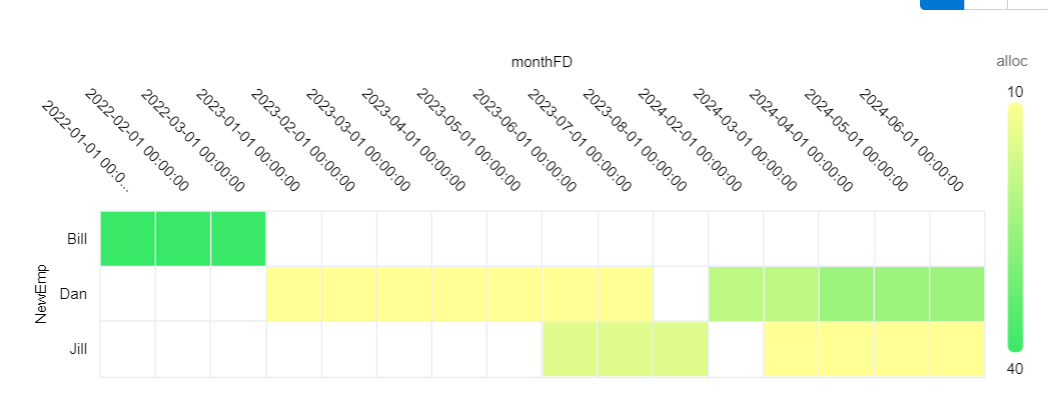
0 Comments
|