A blog series distilling quantitative concepts /use-cases in CRM Analytics (Einstein Analytics)
0 Comments
This setting is enabled in the Salesforce CRM side by your system administrator. Setting this enables accurate fiscal year groupings / filters in TCRM. 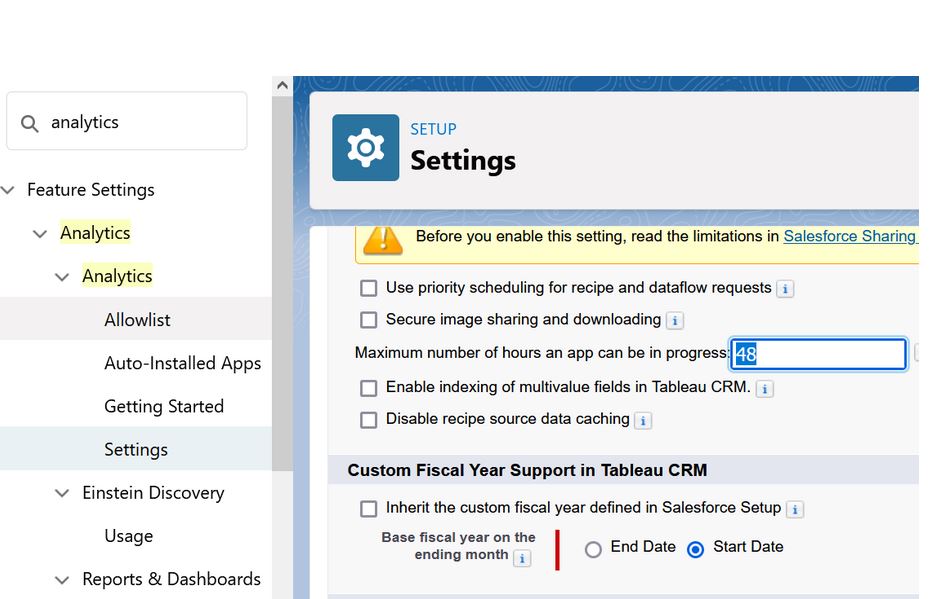 After creating the dataset that contains a flatten transformation, you need to modify the dataset XMD and turn 'isSystemField' to 'false' . This will enable user to see the field in a lens to debug.
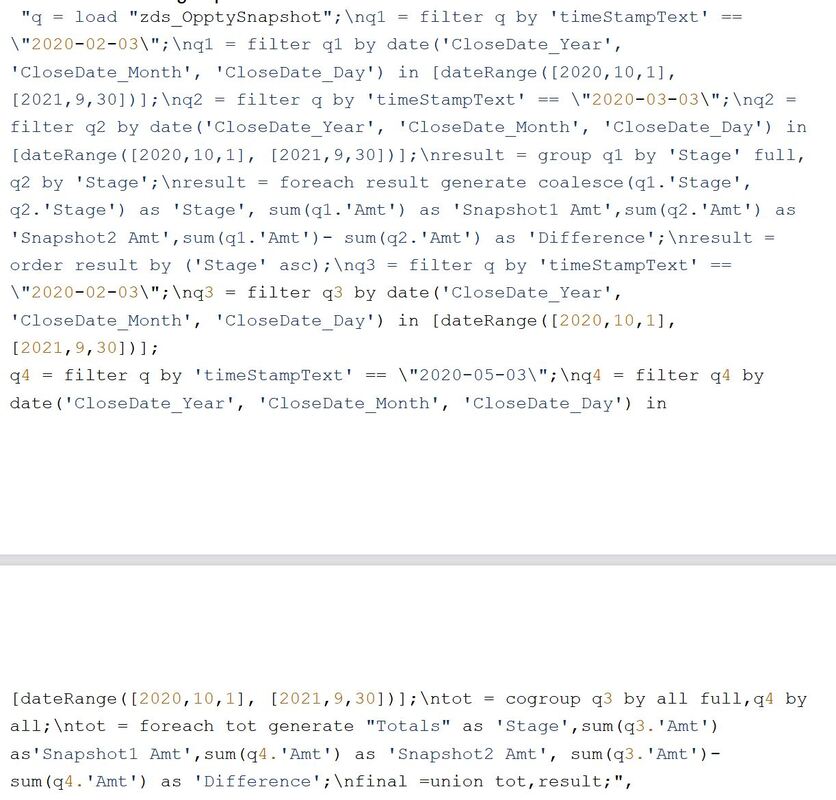
CODE BELOW { "flattnMgr": { "schema": { "objects": [ { "label": "ManagerPathText", "fields": [ { "name": "mgrPath", "label": "mgrPath", "isSystemField": false }, { "name": "ManagersList", "label": "ManagersList", "isSystemField": false } ] } ] }, "action": "flatten", "parameters": { "include_self_id": false, "self_field": "Id", "multi_field": "ManagersList", "parent_field": "ManagerId", "path_field": "mgrPath", "source": "LoadUser" } } so let's say you have a set of metrics that you want to create a time-series on. Maybe your team makes sales forecast on clients that changes over time. You can take a 'snapshot' of that forcast daily thru a scheduled dataflow and an append transformation node. At the end of a certain period your dataset may look like this... Client Date Forecast A January 3 $1000 B January 3 $5000 A March 2 $2000 B March 2 $3000 Code below creates a waterfall chart with a binding to control the grouping trigger. q = load \"zds_IoTForecast5\";\nstartVal = filter q by {{column(qDateTest_1.selection,[\"cTimeStampText\"]).asEquality('cTimeStampText')}};\nendVal = filter q by {{column(q_SnapDate2_1.selection,[\"cTimeStampText\"]).asEquality('cTimeStampText')}};\nq_A = filter q by {{column(qDateTest_1.selection,[\"cTimeStampText\"]).asEquality('cTimeStampText')}};\nq_B = filter q by {{column(q_SnapDate2_1.selection,[\"cTimeStampText\"]).asEquality('cTimeStampText')}};\nstartVal = group startVal by all;\nstartVal = foreach startVal generate \"Start Value\" as '{{column(static_6.selection,[\"Valu\"]).asObject()}}',number_to_string(sum (startVal.'TotValueUSD'),\"$#,###\") as 'Forecast Delta';\nendVal = group endVal by all;\nresult = group q_A by '{{column(static_6.selection,[\"Valu\"]).asObject()}}' full, q_B by '{{column(static_6.selection,[\"Valu\"]).asObject()}}';\nresult = foreach result generate coalesce(q_A.'{{column(static_6.selection,[\"Valu\"]).asObject()}}', q_B.'{{column(static_6.selection,[\"Valu\"]).asObject()}}') as '{{column(static_6.selection,[\"Valu\"]).asObject()}}',coalesce(sum(q_A.'TotValueUSD'),0) as 'A', coalesce(sum(q_B.'TotValueUSD'),0) as 'B';\nresult = foreach result generate '{{column(static_6.selection,[\"Valu\"]).asObject()}}',number_to_string( B-A,\"$#,###\") as 'Forecast Delta';\nendVal = foreach endVal generate \"Ending Value\" as '{{column(static_6.selection,[\"Valu\"]).asObject()}}',number_to_string(sum (endVal.'TotValueUSD'),\"$#,###\") as 'Forecast Delta';\nresult = order result by '{{column(static_6.selection,[\"Valu\"]).asObject()}}' asc;\nfinal = union startVal,result,endVal; 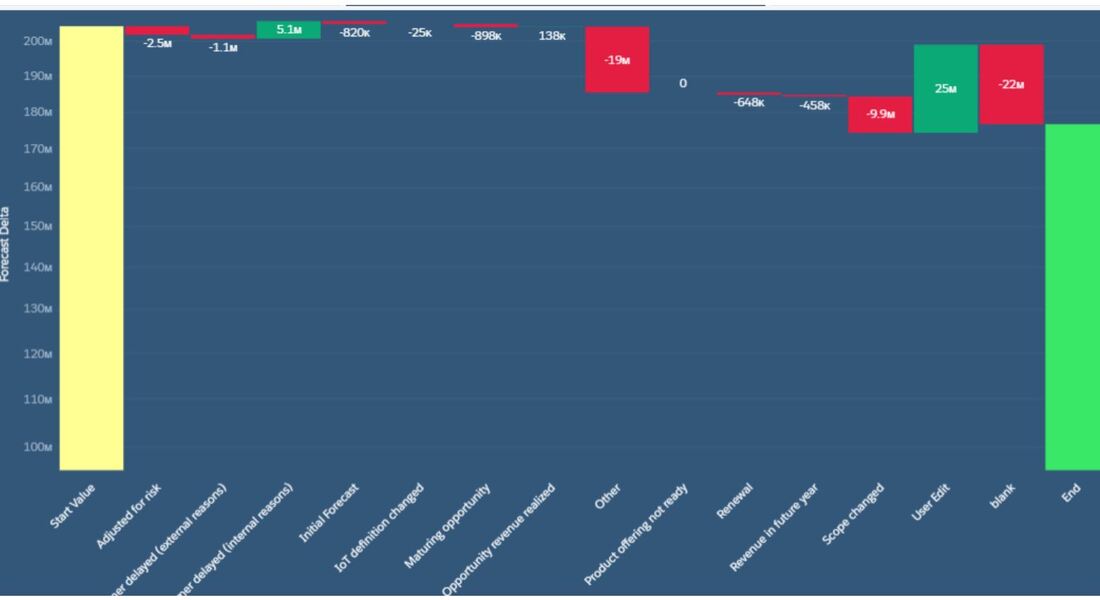 |