A blog series distilling quantitative concepts /use-cases in CRM Analytics (Einstein Analytics)
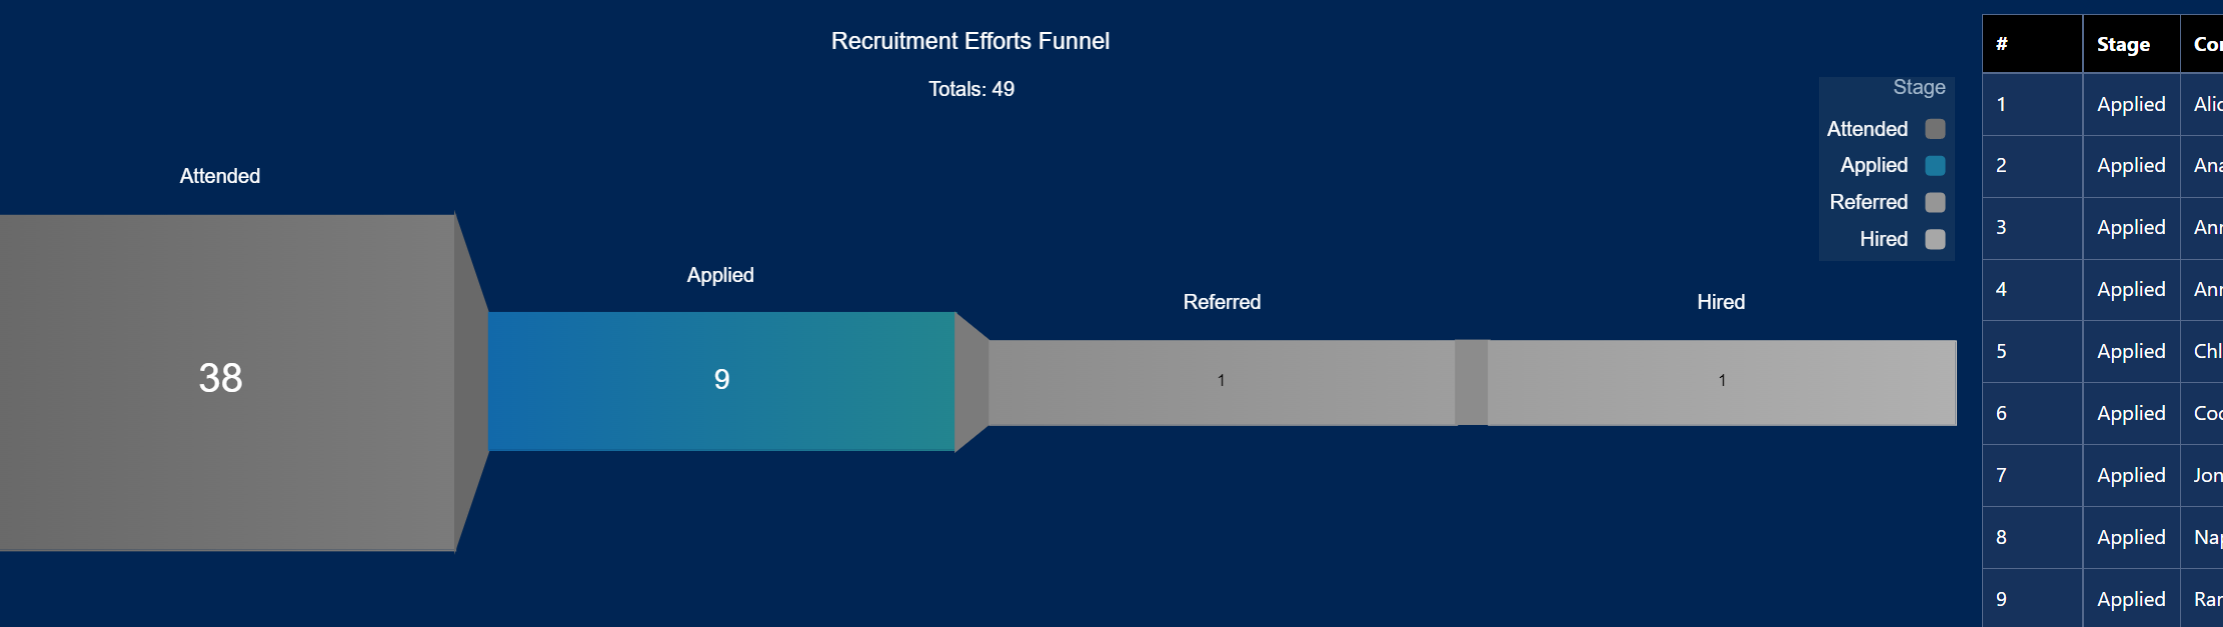
Funnel Chart with detail page faceting.(Bonus!: reordering stagenames w/o showing ordering field)3/5/2023 Below is SAQL code to create a funnel chart based on Stagename and also facet the segment into a table widget.The four different filters creates a separate datastrem to pick out specific rows (q,q2,q3,q4). The 'result=order result by OrdStage orders the rows and then generates the regular stage name.
q = load "x_Appl2Participation"; q2=filter q by 'Appl2Participation.Name' is not null; q3 = filter q by 'Appl2Participation.Status__c' == "Referred" ; q4 = filter q by 'Appl2Participation.contact2Appl.Actual_Start_Date__c' is not null; q = group q by 'Contact_Name__c'; q=foreach q generate 'Contact_Name__c',unique('Contact_Name__c') as 'Totals'; q1=group q by all; q1=foreach q1 generate "Attended" as 'Stage',count() as 'Totals'; q2 = group q2 by 'Contact_Name__c'; q2=foreach q2 generate 'Contact_Name__c' as 'Contact_Name__c',unique('Contact_Name__c') as 'Totals'; q2=group q2 by all; q2=foreach q2 generate "Applied" as 'Stage', count() as 'Totals'; q3=group q3 by all; q3=foreach q3 generate "Referred" as 'Stage', count() as 'Totals'; q4=group q4 by 'Contact_Name__c'; q4=foreach q4 generate unique('Contact_Name__c') as 'Totals'; q4=group q4 by all; q4=foreach q4 generate "Hired" as 'Stage',count() as 'Totals'; result=union q1,q2,q3,q4; result=group result by 'Stage'; result=foreach result generate 'Stage' as 'Stage', (case when 'Stage'=="Hired" then "4-Hired" when 'Stage'=="Attended" then "1-Attended" when 'Stage'=="Applied" then "2-Applied" when 'Stage'=="Referred" then "3-Referred" end) as 'OrdStage',sum('Totals') as 'Totals'; result=order result by 'OrdStage'asc; result=foreach result generate 'Stage' as 'Stage',sum('Totals') as 'Totals'; CODE BELOW IS FOR THE TABLE WIDGET WITH FUNNEL_2 beign the name of the above funnel chart. q = load "x_Appl2Participation"; q2=filter q by 'Appl2Participation.Name' is not null; q3 = filter q by 'Appl2Participation.Status__c' == "Referred" ; q4 = filter q by 'Appl2Participation.contact2Appl.Actual_Start_Date__c' is not null; q = group q by 'Contact_Name__c'; q=foreach q generate "Attended" as 'Stage', 'Contact_Name__c'; q2 = group q2 by 'Contact_Name__c'; q2=foreach q2 generate "Applied" as 'Stage','Contact_Name__c' as 'Contact_Name__c'; q3=foreach q3 generate "Referred" as 'Stage','Contact_Name__c' as 'Contact_Name__c'; q4=group q4 by 'Contact_Name__c'; q4=foreach q4 generate "Hired" as 'Stage','Contact_Name__c' as 'Contact_Name__c'; result=union q,q2,q3,q4; result2=filter result by 'Stage' =="{{column(funnel_2.selection, ["Stage"]).asObject()}}"; result2=foreach result2 generate 'Stage' as 'Stage', 'Contact_Name__c' as 'Contact_Name__c';
0 Comments
Leave a Reply. |
Archives
June 2025
|